Polkadot (DOT) Is Stuck Below $42 Resistance, Upward Move Is Likely
Estimated Reading Time: 2 minutes
Don’t invest unless you’re prepared to lose all the money you invest. This is a high-risk investment and you are unlikely to be protected if something goes wrong. Take 2 minutes to learn more
Polkadot (DOT) Long-Term Analysis: Bullish
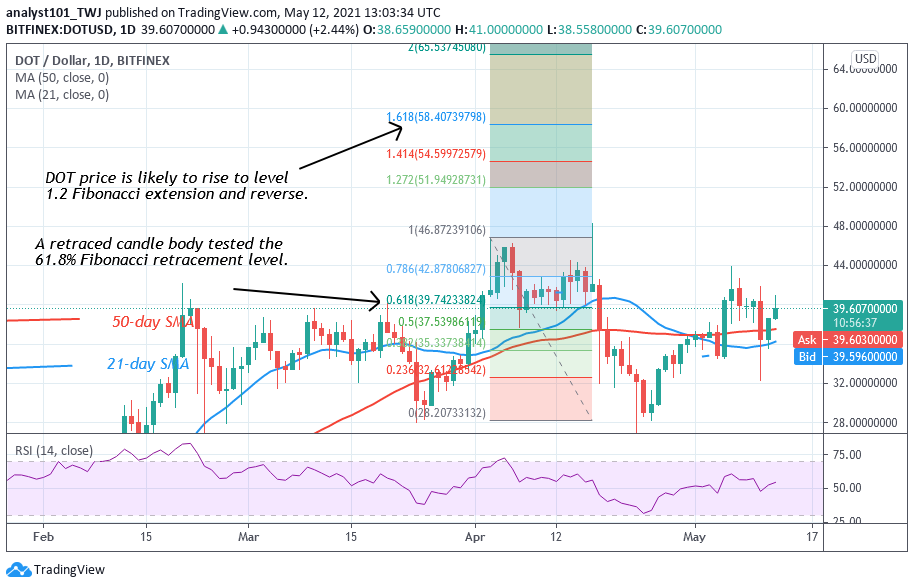
Polkadot’s (DOT) price is stuck below the $42 resistance level. Since April 5, buyers are yet to break the resistance level. On May 6, the resistance was tested and the altcoin fell to the low of $32. The bulls bought the dips to resume a fresh uptrend. A rally to $60 is possible if buyers break the resistance level. On April 3 uptrend, a retraced candle body tested the 61.8% Fibonacci retracement. This indicates that DOT price will rise to level 1.618 Fibonacci extension or the high of $58.450.
Polkadot (DOT) Indicator Analysis
DOT price is at level 54 of the Relative Strength Index period 14. It indicates that the market is in an uptrend zone above the centerline 50. The 21-day and 50-day SMAs are sloping horizontally indicating the sideways move.
Technical indicators:
Major Resistance Levels – $48, $52, $56
Major Support Levels – $32, $28, $24
What Is the Next Direction for Polkadot (DOT)?
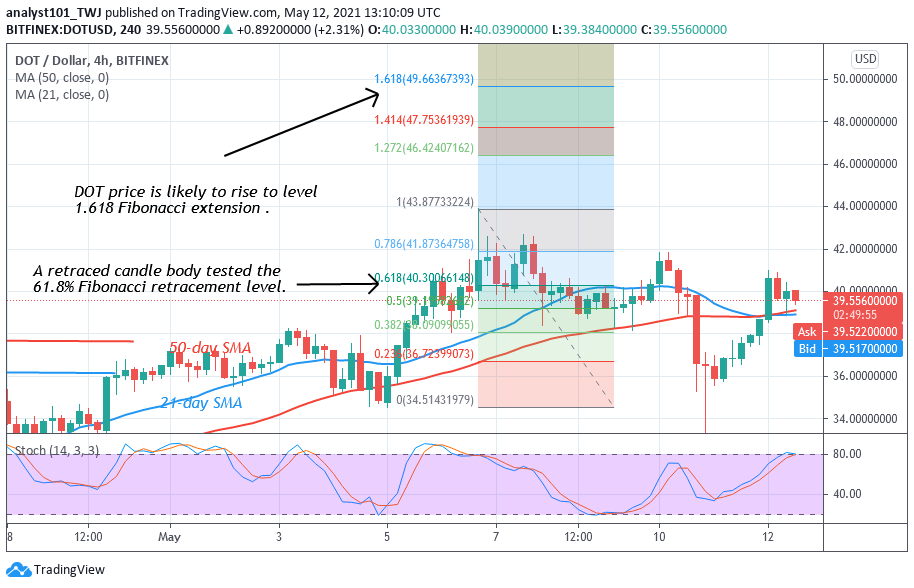
On the 4 hour chart, DOT price is in a sideways trend below the $42 resistance. DOT price is retesting the resistance level to break it. Today, the DOT price is retracing after testing the resistance level. On May 6 uptrend, a retraced candle body tested the 61.8% Fibonacci retracement. The retracement indicates that DOT price will rise to level 1.618 Fibonacci extension or the high of $49.66.
Note: cryptosignals.org is not a financial advisor. Do your research before investing your funds in any financial asset or presented product or event. We are not responsible for your investing results


