Polkadot (DOT/USDT) Breaks Below Dynamic Support Levels
Estimated Reading Time: 3 minutes
Don’t invest unless you’re prepared to lose all the money you invest. This is a high-risk investment and you are unlikely to be protected if something goes wrong. Take 2 minutes to learn more
Polkadot Long-term Analysis: Bearish
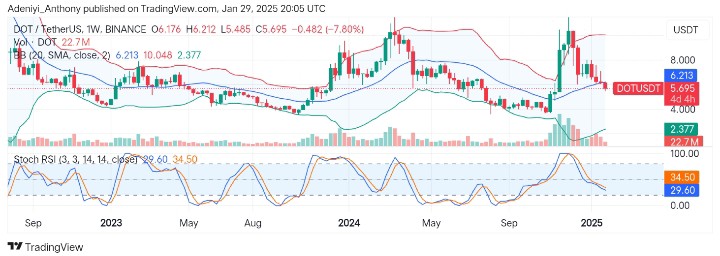
The market for Polkadot against the Tether has experienced a strong downtrend after the price broke above the $10.048 level in the previous trade. This highlights the struggle to regain bullish momentum as prices decline 7.80% for the week.
Recently, DOT/USDT has seen a further downtrend as the price retraced below the dynamic support at $6.213 as the oscillator below the weekly chart signals an oversold condition for the pair.
Currently, Polkadot trades at $5.695, with over 22 million traded volumes.
Technical Indicators
Major Resistance Levels: $6.220, $7.100, and $8.000
Major Support Levels: $5.000, $4.500, and $2.377
Polkadot Technical Analysis
The analysis of Polkadot against the Tether on a weekly timeframe shows that the pair is on a strong downtrend as suggested by the current and previous price movements. The Bollinger bands seem to be diverging, signaling increased volatility and strong selling pressure.
However, the Stochastic RSI indicates a bearish momentum as the lines read 34.50 and 29.60. This signals the pair approaches a critical oversold zone, indicating a potential reversal might surface in the near term.
To this end, expectations in the short term revolve around the ability to stabilize at the current level, followed by potential attempts to reclaim the $6.213 dynamic level if bullish momentum emerges.
DOT/USDT Analysis: What’s Next?
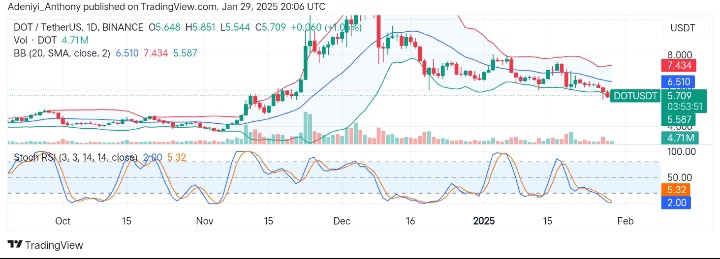
The daily chart for DOT/USDT is showing signs of mild recovery as the pair sees a gain of 1.05% for the day. Though the price action around the lower Bollinger band indicates an oversold condition, the intended opening of the bands indicates price might retrace to the North soon.
On the other hand, the Stochastic RSI suggests the pair may be due for an upside movement if buyers step in as the indicator’s lines read below the 10-mark level. However, the bearish trend remains intact; the price may test the immediate support level before attempting a breakout above $6.510, but a break below $5.200 would indicate a further downtrend.
You can purchase crypto coins here. Buy LBlock