Ripple Finds Support above $0.84 as Buyers Resume Fresh Uptrend
Estimated Reading Time: 2 minutes
Don’t invest unless you’re prepared to lose all the money you invest. This is a high-risk investment and you are unlikely to be protected if something goes wrong. Take 2 minutes to learn more
![]()
Ripple (XRP) Long-Term Analysis: Bearish
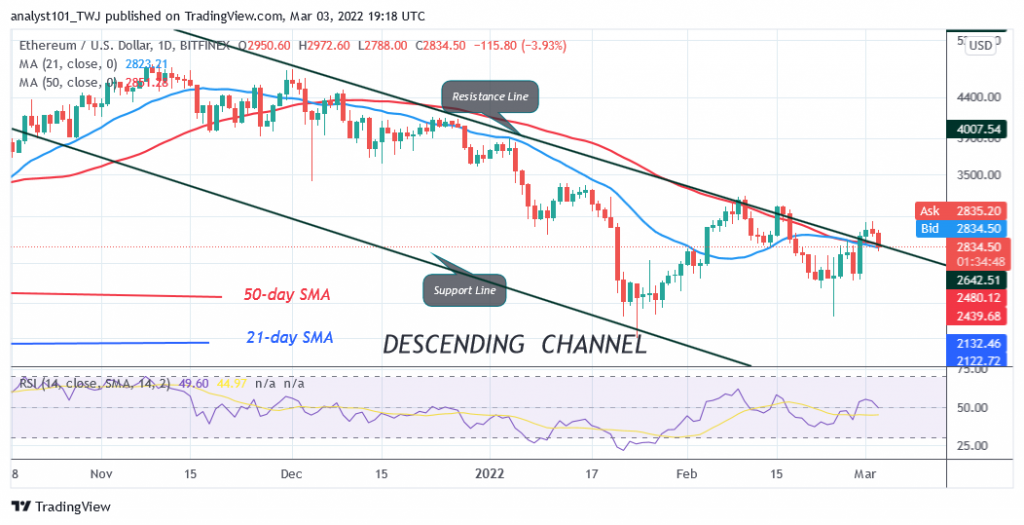
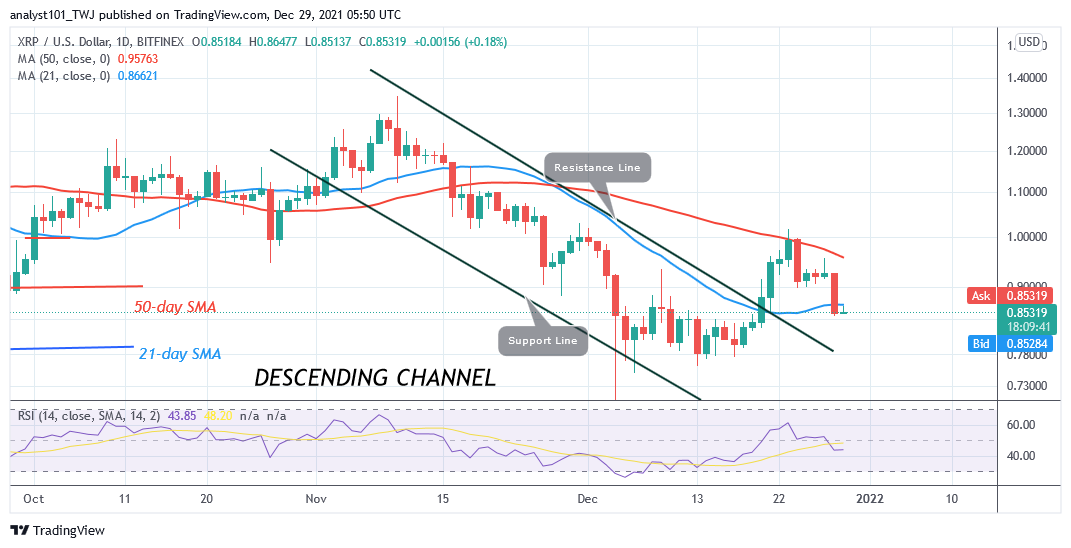
Today, Ripple’s (XRP) price has fallen below the moving averages as buyers resume fresh uptrend. Incidentally, if buyers have sustained the price above the 50-day line SMA or $1.00 high, XRP/USD would be out of downward correction. The cryptocurrency would have resumed upside momentum. Ripple will rise to revisit the previous highs of $1.10 and $1.30. Today, XRP has fallen to the previous range-bound zone. The cryptocurrency is likely to fluctuate between $0.76 and $1.00. XRP/USD is trading at $0.85 at press time.
Ripple (XRP) Indicator Analysis
XRP is at level 43 of the Relative Strength Index for period 14. The RSI has dropped because of the recent selling pressure. The crypto’s price is below the 21-day moving average and the 50-day line moving average indicating a possible decline. Ripple is above the 30% area of the daily stochastic. The market has resumed a bullish momentum.
Technical indicators:
Major Resistance Levels – $2.00, $2.50, $3.00
Major Support Levels – $1.50, $1.00, $0.50
What Is the Next Direction for Ripple (XRP)
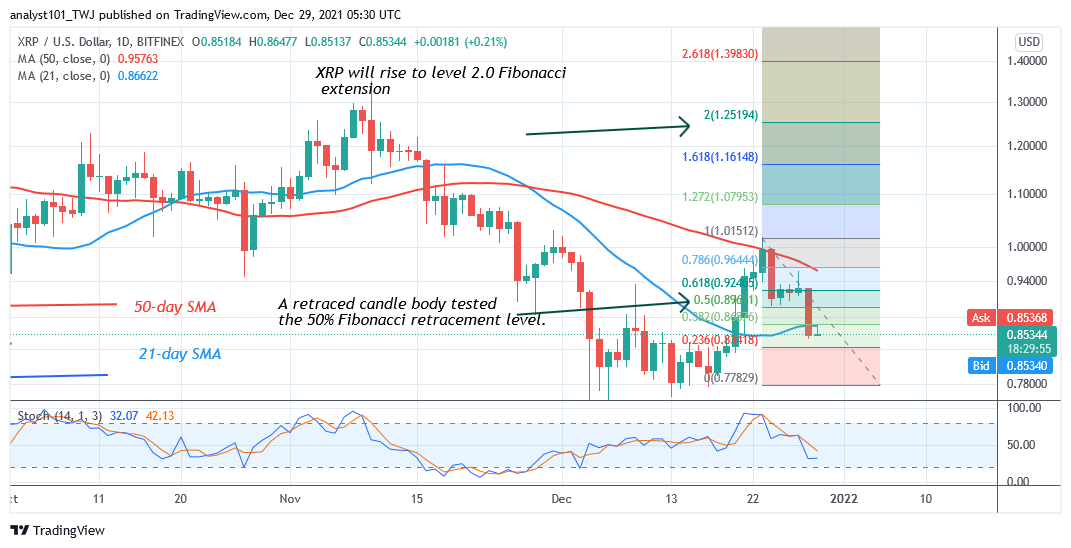
Ripple has fallen to the bottom of the chart as buyers resume fresh uptrend. Meanwhile, on December 23 uptrend; a retraced candle body tested the 50% Fibonacci retracement level. The retracement suggests that XRP will rise to level 2.0 Fibonacci extension or $1.25.
You can purchase crypto coins here. Buy Tokens
Note: Cryptosignals.org is not a financial advisor. Do your research before investing your funds in any financial asset or presented product or event. We are not responsible for your investing results