Berachain Price Struggles to Reclaim Support Amid Intensifying Bearish Momentum
Estimated Reading Time: 3 minutes
Don’t invest unless you’re prepared to lose all the money you invest. This is a high-risk investment and you are unlikely to be protected if something goes wrong. Take 2 minutes to learn more

Berachain (BERA) is having a time staying above support levels with a stark 31% drop this week, significantly underperforming the 4.20% recovering crypto market. However, it appears that the Berachain price has seen another 24-hour decline, as the price dropped 1.62%, with investor sentiment remaining deeply bearish due to technical weakness.
As it stands, the primary concern at the moment remains the $30.8 million token unlock, a 41.7% increase in circulating supply into the market. To this end, this massive influx of sellable tokens creates high dilution risk and heavy selling pressure, leaving BERA in a dangerous position as it trades well below key support levels.
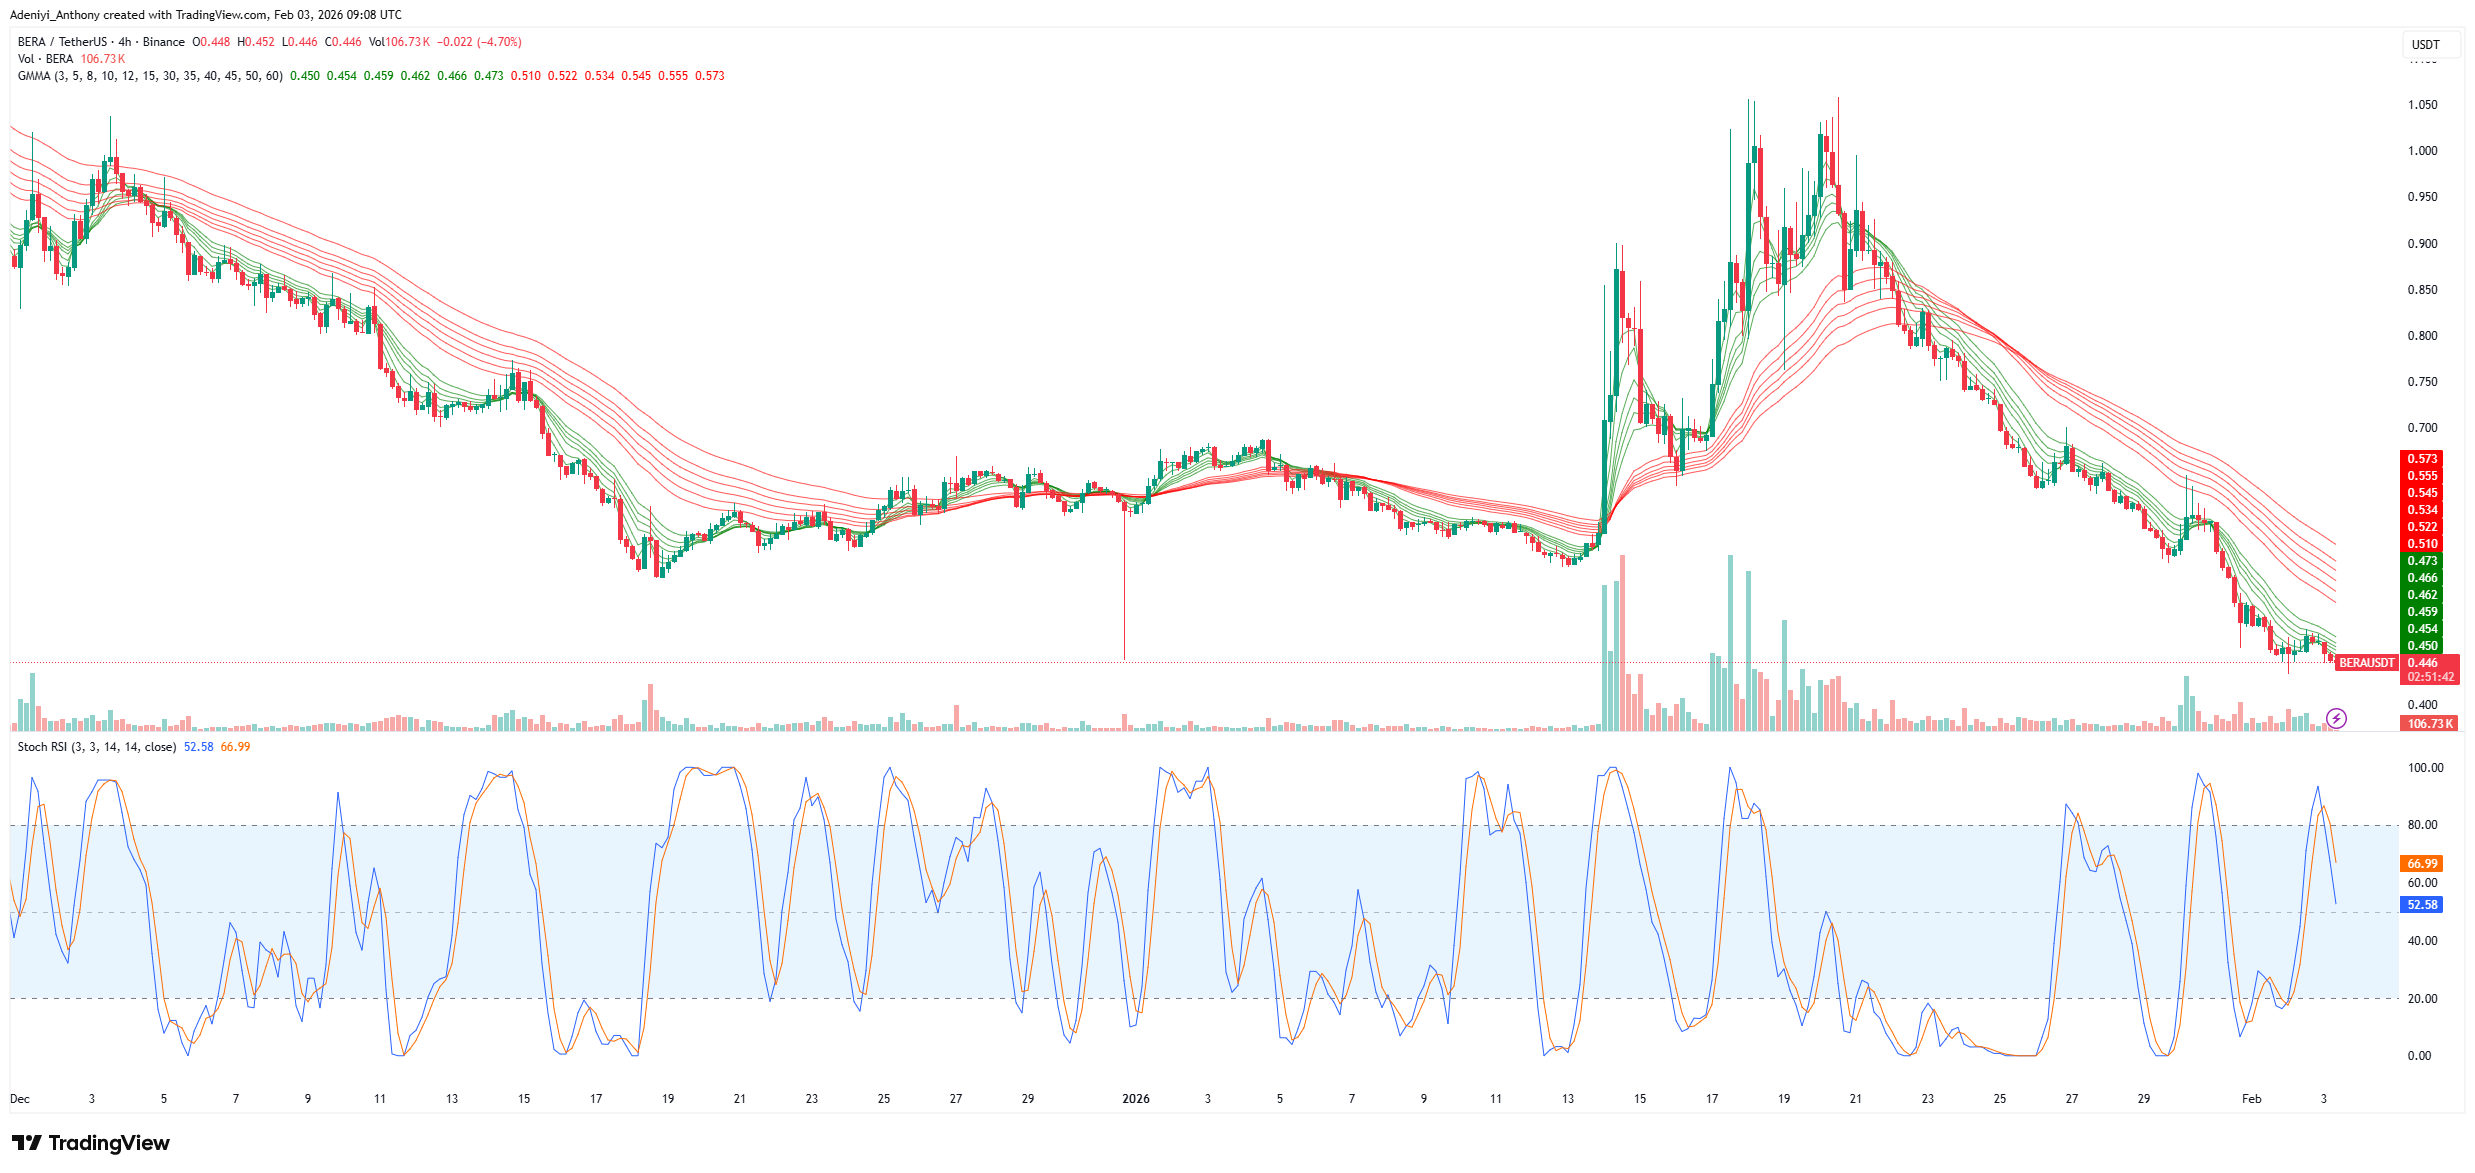
Currently, Berachain trades at $0.446 with more than 106,000 traded volumes on the 4-hour timeframe.
Technical Indicator
Major Resistance Levels: $0.550, $1.060, and $1.200
Major Support Levels: $0.430, $0.400, and $0.300
Technical Analysis
On the 4-hour timeframe, Berachain against Tether appears to be stuck in a downward-sloping pattern. The Guppy Multiple Moving Averages (GMMA) seems to be trending downward with increasing momentum as the gap between the sets of Exponential Moving Averages widens.
Additionally, the Stochastic RSI signals that the momentum favors the sellers as the lines head south. To this end, if the price stays above $0.45, it could finally start to bounce back soon.
Meanwhile, @Cexscan reported in a recent post on X that Berachain (BERA) was facing a significant downtrend. The firm noted that the Berachain price appears to be trading below its key Exponential Moving Averages (EMAs), signaling a bearish sentiment. Also, the relative strength index seems to be exhibiting bearish momentum despite the steadiness in the market. To this end, it was concluded that BERA’s technical indicators suggested continued downward pressure and weakness in its current price action.
Technical Analysis: BERA/USDT
Executive Summary
Berachain (BERA) is currently experiencing a significant downtrend, trading below its key Exponential Moving Averages (EMAs) and exhibiting bearish signals from the Relative Strength Index (RSI). Despite a relatively stable market… pic.twitter.com/ZCbmhK5Egc— cexscan (@cexscan) January 29, 2026
BERA/USDT Analysis: What’s Coming Next?
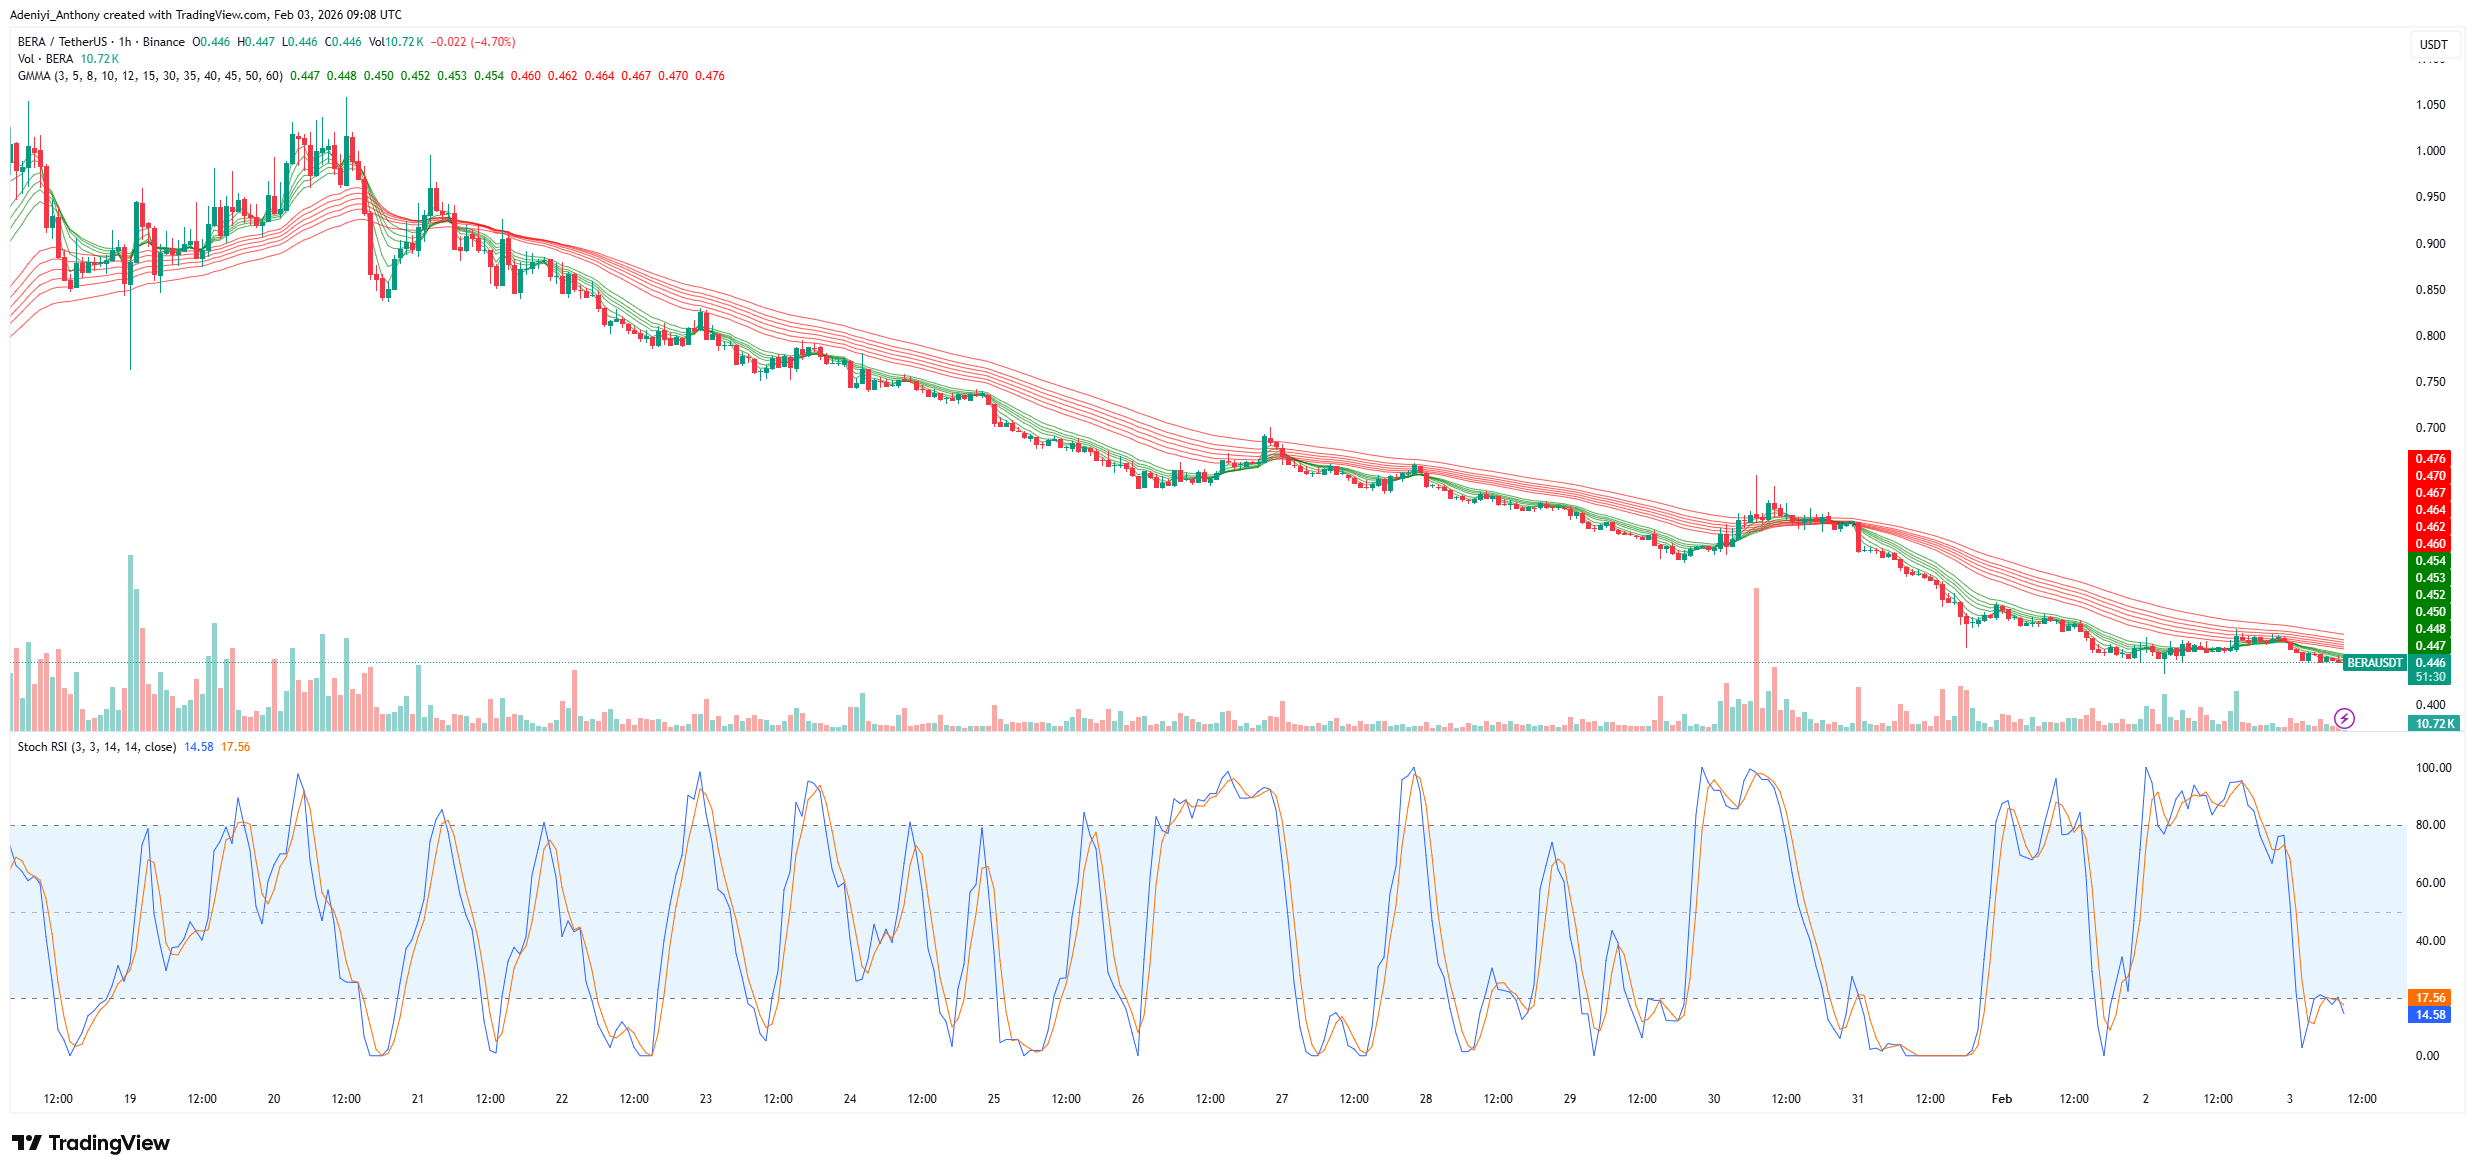
On the hourly chart, BERA/USDT analysis showed that the price is moving sideways. Berachain price appears to be squeezing between $0.45 and $0.48, a pattern that precedes a quick up or down. The GMMA seems to be exhibiting a sign that impending relief is on the horizon, with the price still operating within the bearish structure.
However, the momentum oscillator signals an oversold condition, suggesting a bounce in the coming session, provided the pair manages to hold above the $0.45 mark. To this end, a break below the current level would signal a move towards $0.300.
You can purchase crypto coins here. Buy Crypto