Bitcoin (BTC) Price Prediction: BTC/USDT Continues to Generally Advance in Upside Correction
Estimated Reading Time: 2 minutes
Don’t invest unless you’re prepared to lose all the money you invest. This is a high-risk investment and you are unlikely to be protected if something goes wrong. Take 2 minutes to learn more

Date: December 10, 2025
The Bitcoin market has generally continued its upward movement. The upside correction began after the market appeared to have located a support level around the $84,000 price mark. Let’s examine how this may continue.
BTC/USDT Long-Term Trend — Bullish (Daily Chart)
Key Price Levels
Resistance: $93,500, $95,250, $98,000
Support: $91,000, $89,000, $86,000
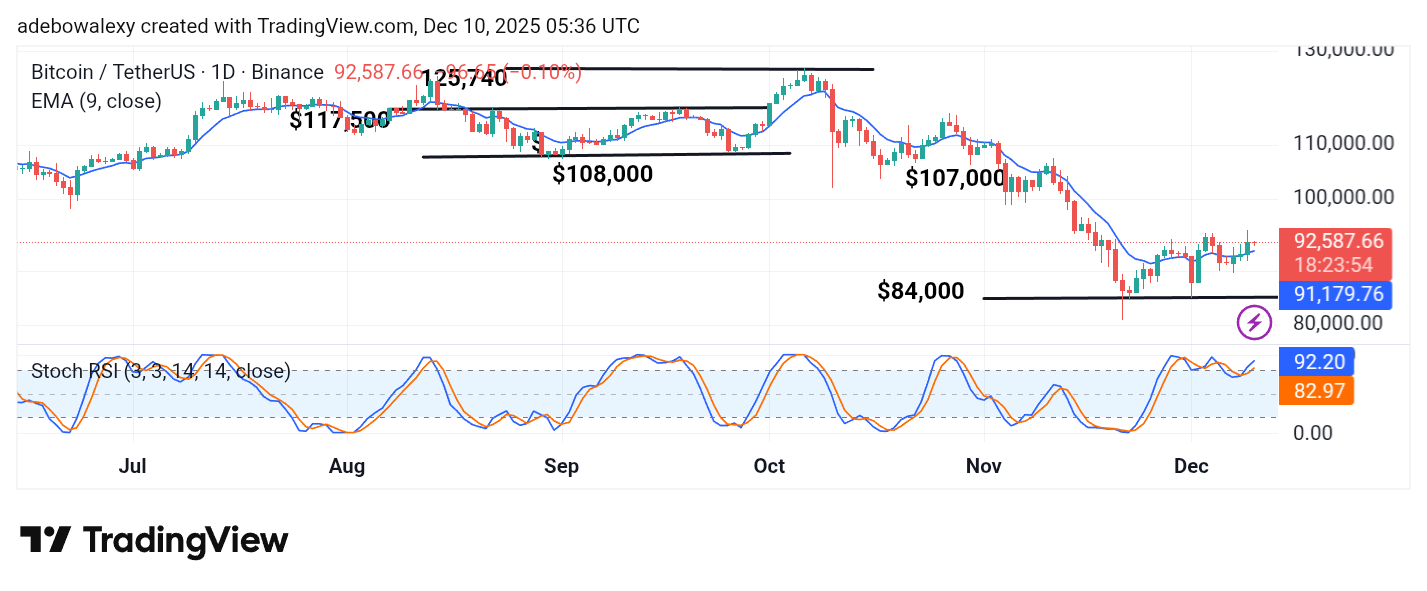
Price movement in the Bitcoin daily market has risen above the 9-day Exponential Moving Average (EMA) line. The most recent price candle appears as a small red candle; however, it still stands above the 9-day EMA curve. Meanwhile, the Stochastic Relative Strength Index (SRSI) indicator lines can be seen rising steadily into the overbought region.
Bitcoin Price Prediction: BTC/USDT May Hit Higher Ground Still
The Bitcoin market has made a considerable recovery upward after hitting support at the $84,000 price level. The previous session pushed the market clearly above the 9-day EMA curve. Although the ongoing session has presented a modest downward pullback, price action remains above the 9-day EMA.
At the same time, the SRSI indicator lines continue rising toward the overbought zone. The lead line is around 92.20, while the lagging line stands at 82.97. Technically, this suggests that bulls still have room to expand bullish activity.
Bitcoin Price Prediction: BTC/USDT Tries to Take a Strong Stand (4-Hour Chart)
On the 4-hour chart, Bitcoin’s price action has also risen above the 9-day EMA curve. Things appear more interesting here, as the market retraced downward over the past two sessions but seems to have regained strong footing in the current session.
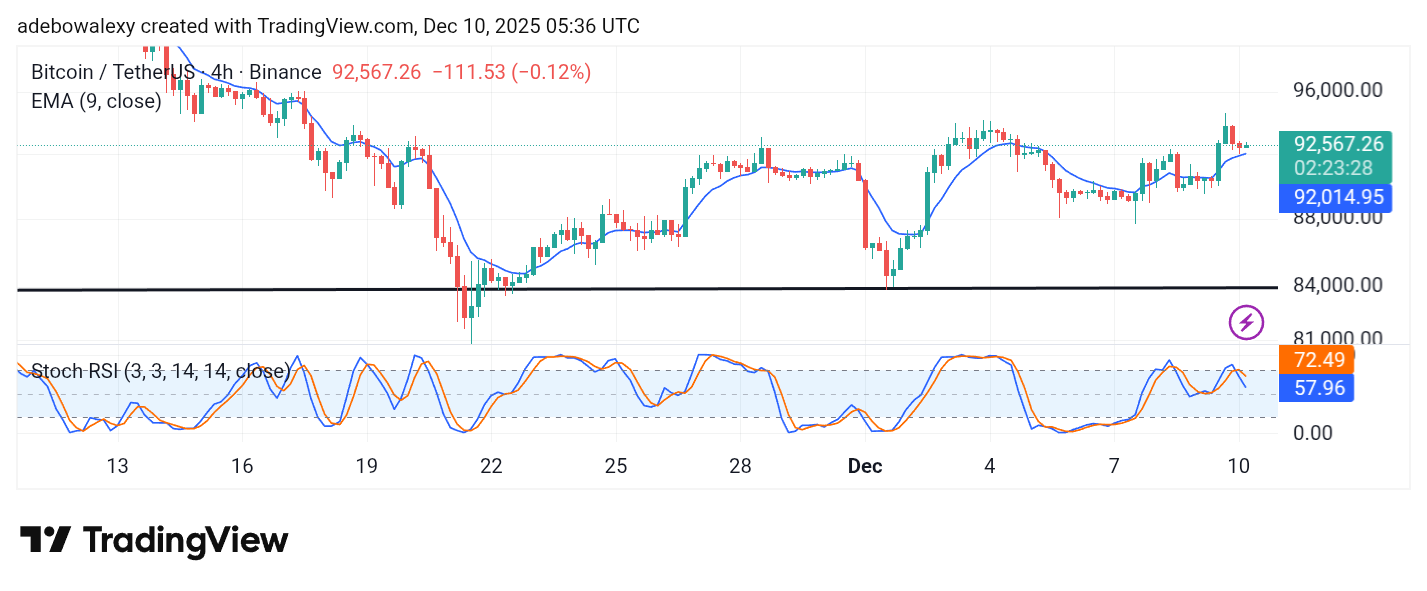
The latest candle on the 4-hour chart is a small green candle positioned above the 9-day EMA line. Meanwhile, the SRSI indicator lines have descended below the 80 mark. At this point, a resultant upside retracement may extend toward the $95,000 mark.