Bitcoin (BTC) Price Prediction: BTC/USDT Gets Pulled Towards a Medium-Term Support
Estimated Reading Time: 2 minutes
Don’t invest unless you’re prepared to lose all the money you invest. This is a high-risk investment and you are unlikely to be protected if something goes wrong. Take 2 minutes to learn more

Date: December 17, 2025
The Bitcoin market has been trading below the 100K mark for weeks. However, recently it tested a medium-term support at the $84,000 mark. And while the token still trades above the mentioned price level, it seems a retest of that price mark is on the way.
BTC/USDT Long-Term Trend — Bearish (Daily Chart)
Key Price Levels
Resistance: $90,000, $92,500, $95,000
Support: $87,000, $85,000, $84,000
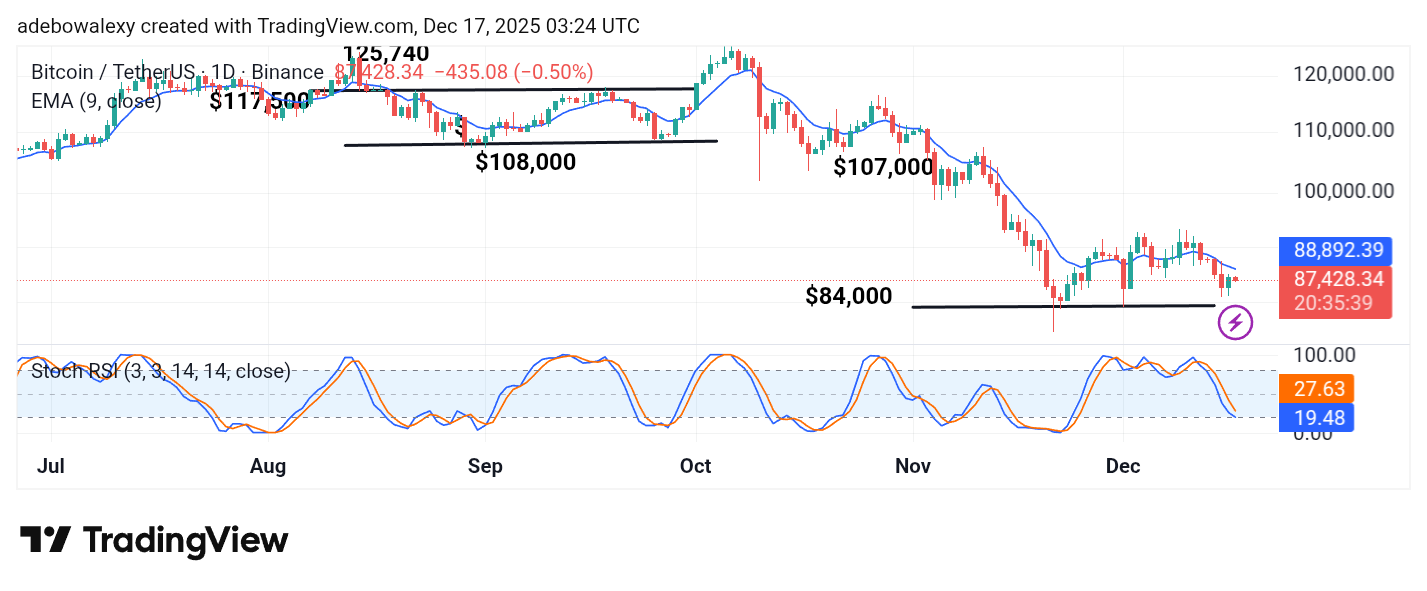
The market recently retreated again below the 9-day Exponential Moving Average (EMA) line. This confined the ongoing session below the 9-day EMA curve. Also, the corresponding price candle is a red one. Meanwhile, the lines of the Stochastic Relative Strength Index (SRSI) indicator have continued falling into the oversold region. The lead line can be seen already poking through the level 20 of the indicator.
Bitcoin Price Prediction: BTC/USDT Poised to Continue Its Descent
On the daily chart, one can see that the Bitcoin market is in need of a catalyst. The market has kept on approaching lower support levels. The last price candle here is a red one and suggests that headwinds are still generally in the lead.
Also, the fact that price activity is now below the 9-day EMA curve confers a strong bearish impression on the market. Similarly, the SRSI indicator lines are still descending into the oversold region, which aligns with the general bearish impression about the market.
Bitcoin Price Prediction: BTC/USDT Prepares to Continue South (4-Hour Chart)
Coming to the Bitcoin market on the 4-hour chart reveals that bears are maintaining consistency. Here as well, the last price candle has appeared red. Likewise, it has just broken the support provided by the 9-day EMA curve.
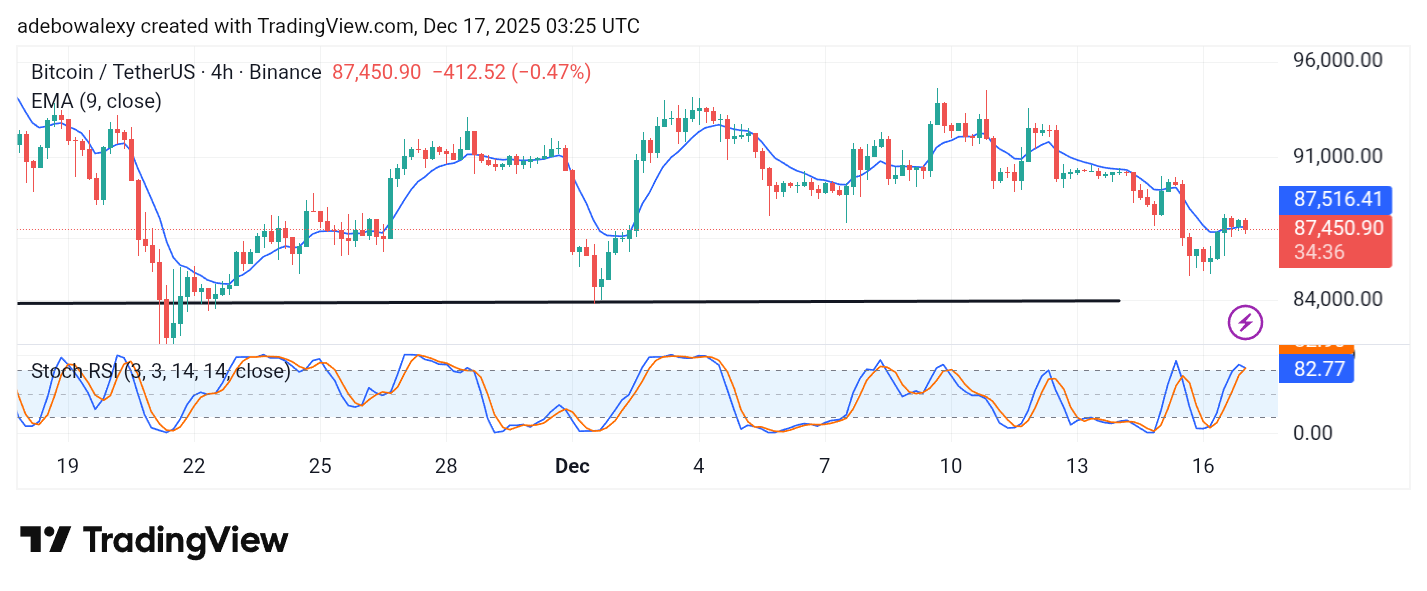
Additionally, one can see that the SRSI indicator lines are converged above the 20 level.
By considering the trajectory of price action and the convergence of the SRSI, it seems more probable that this market may proceed toward the support at the $84,000 price level. And should traders be eyeing the support level for a re-accumulation, an upward rebound may result from that price level.