Bitcoin (BTC) Price Prediction: BTC/USDT Is Leaping Higher, Nears $108,000 Mark
Estimated Reading Time: 3 minutes
Don’t invest unless you’re prepared to lose all the money you invest. This is a high-risk investment and you are unlikely to be protected if something goes wrong. Take 2 minutes to learn more
Date: May 21, 2025
The Bitcoin market has been experiencing significant price movement lately. Currently, the price of this token is approaching the $108,000 level. Furthermore, by loosely observing this market, one will see that upside forces still have significant momentum to push this market higher.
BTC/USDT Long-Term Trend: Bullish (Daily Chart)
Key Price Levels:
Resistance: $110,000, $120,000, $130,000
Support: $100,000, $90,000, $80,000
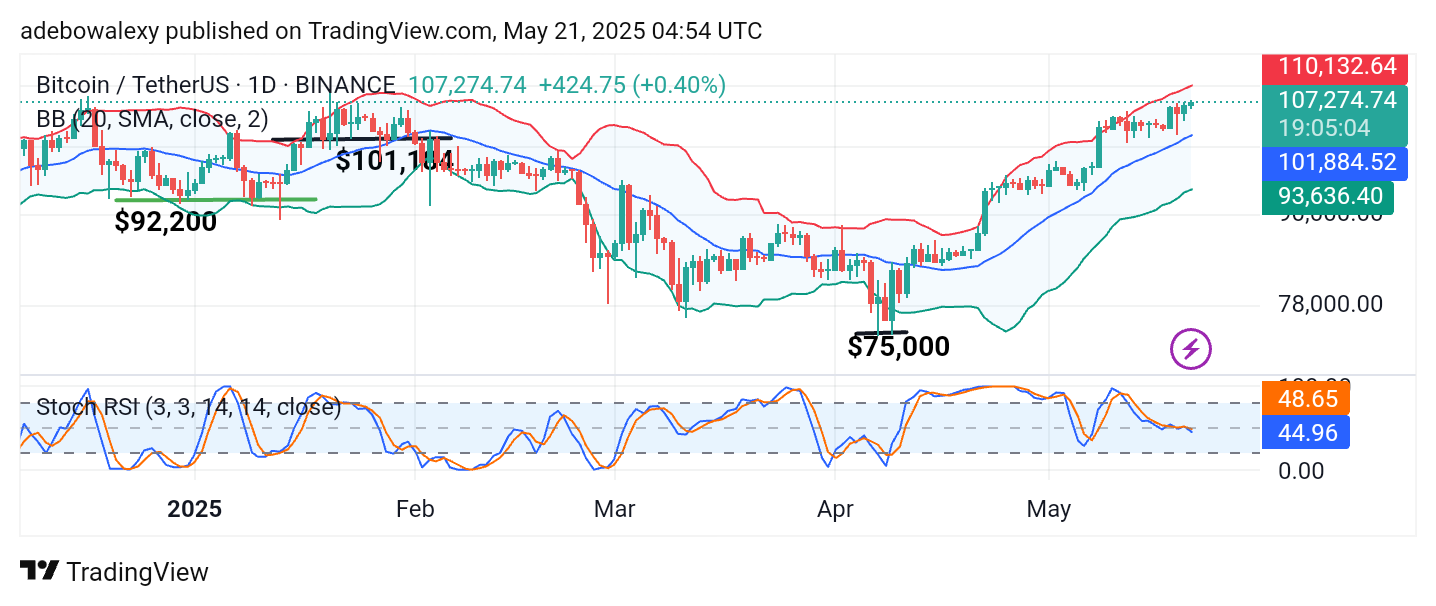
Price activity on the Bitcoin daily chart remains in the green. The most recent price candle has shown moderate gains as it lingers near the upper limit of the Bollinger Bands. Consequently, the Bollinger Indicator continues on an upward trajectory. However, while price activity is tending toward higher levels, it can be observed that the Stochastic Relative Strength Index (SRSI) lines are only moving slightly sideways following a recent crossover.
Bitcoin (BTC) Price Prediction: BTC/USDT May Gain More Traction
The Bitcoin market on the daily chart hints at the possibility of further upward price movement. The ongoing session has shown some bullish retracement, keeping the market on an upward path. As a result, the Bollinger Bands maintain a steady upward slope.
The SRSI indicator lines, however, are not moving aggressively, trending somewhat sideways. Nevertheless, given the current state of the market, it appears that price action still has room to advance toward much higher levels.
Bitcoin (BTC) Price Prediction: BTC/USDT Stays Consistent with Gains
Looking at the Bitcoin 4-hour chart, it is evident that the coin continues to benefit from bullish forces. Price activity over the past few trading sessions has remained close to the upper limit of the Bollinger Bands. The current session also appears bullish, reinforcing that the market remains on an upward trajectory.
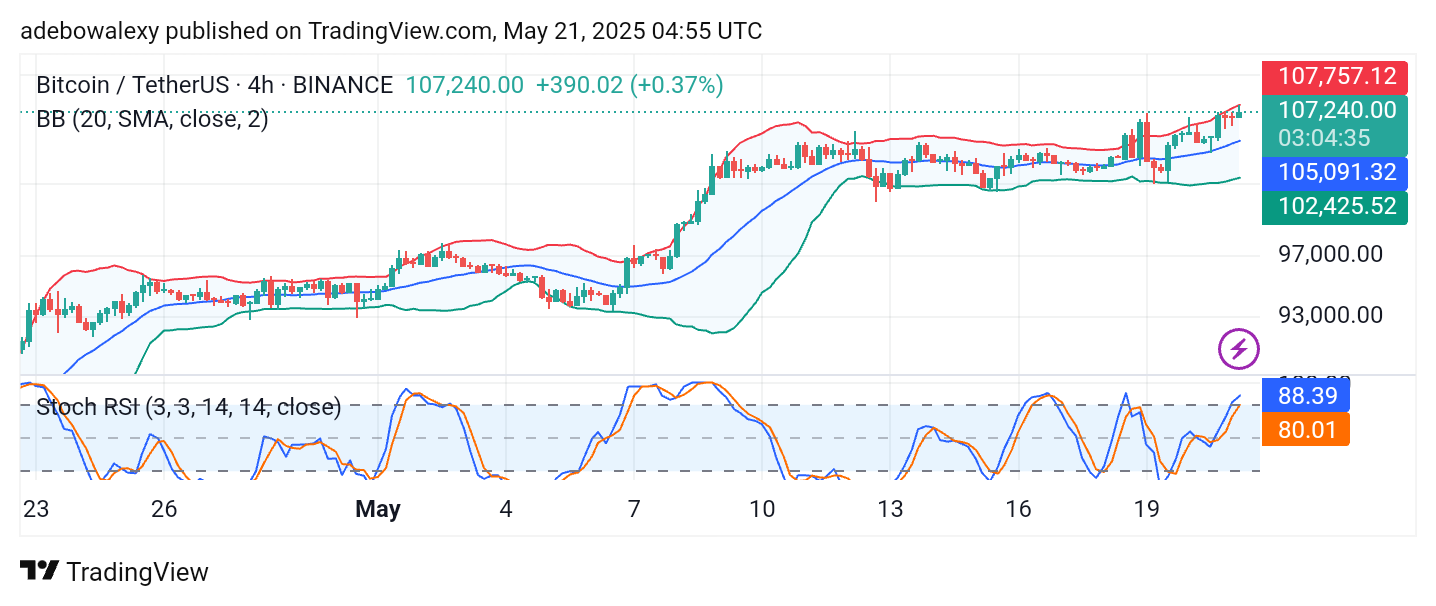
Additionally, the terminals of the Bollinger Bands indicator are projected upward, supporting this bullish outlook. Meanwhile, the SRSI indicator also trends upward, affirming the prevailing sentiment. Traders can expect this market to potentially reach the $109,000 or even the $110,000 level.