Litecoin (LTC) Price Prediction: LTC/USDT Breaches a Key Support
Estimated Reading Time: 3 minutes
Don’t invest unless you’re prepared to lose all the money you invest. This is a high-risk investment and you are unlikely to be protected if something goes wrong. Take 2 minutes to learn more

Date: May 20, 2025
The Litecoin market recently regained some upside momentum, having grown from near the $70 price level to trade above $100. However, there has been some downward retracement, and the ongoing session has produced critical support, which may imply further price descent.
LTC/USDT Long-Term Trend: Bullish (Daily Chart)
Key Price Levels:
Resistance: $100, $120, $140
Support: $90, $80, $70
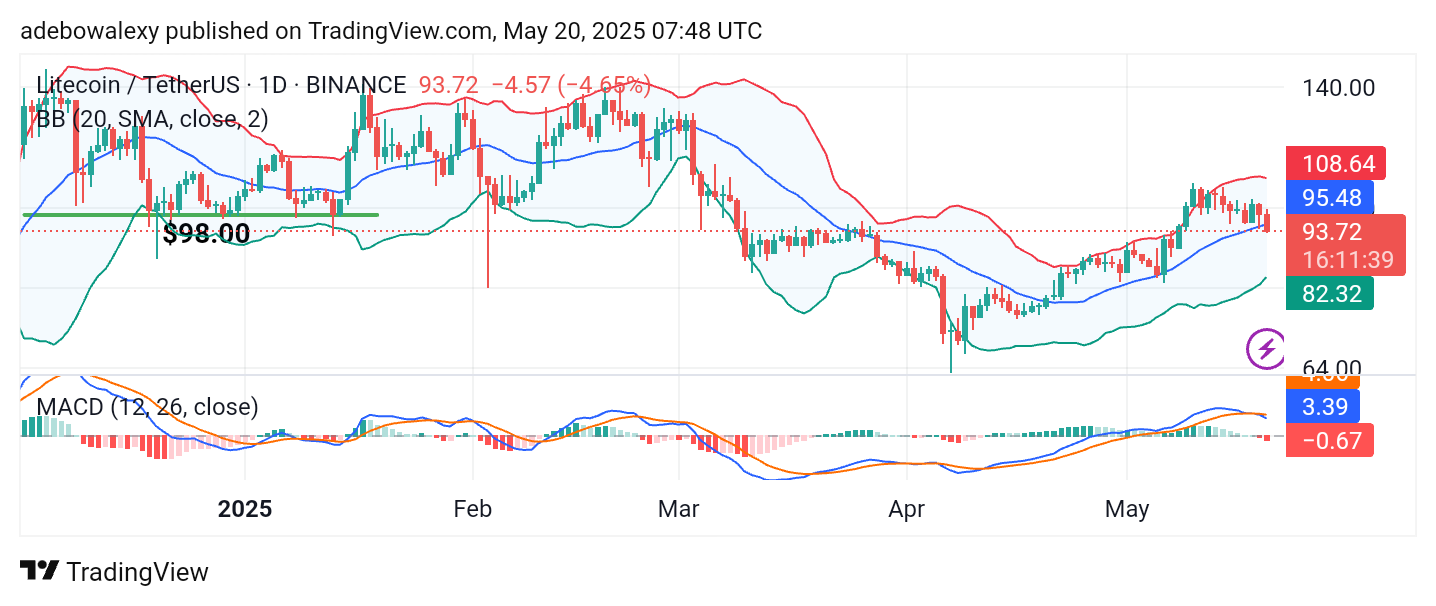
Price action on the Litecoin daily chart has fallen below a very important technical level. The current session’s price candle appears red and has placed the token’s price below the midline of the Bollinger Bands. Likewise, the Moving Average Convergence Divergence (MACD) lines are above the equilibrium level but have just delivered a downward crossover. Nevertheless, the Bollinger Bands indicator itself maintains an upward trajectory.
Litecoin (LTC) Price Prediction: LTC/USDT Has a Short-Term Bearish Outlook
The Litecoin market appears to have undergone a bearish test. However, this downward movement may be short-lived. The most recent price candle suggests further weakness, having fallen below the middle line of the Bollinger Bands.
Additionally, following the downward crossover on the MACD indicator, the histogram bars are now appearing red below the equilibrium level. The MACD lines have started descending toward the equilibrium level. Despite these signs, the Bollinger Bands remain projected upwards, indicating that the market is still holding on to longer-term bullish hopes.
Litecoin (LTC) Price Prediction: LTC/USDT Dips Strongly
By extending this analysis to a shorter time frame, we can see that price action dipped significantly during the ongoing session. As a result, the last price candle is testing the lower boundary of the Bollinger Bands. Furthermore, the MACD lines are now below the equilibrium level.
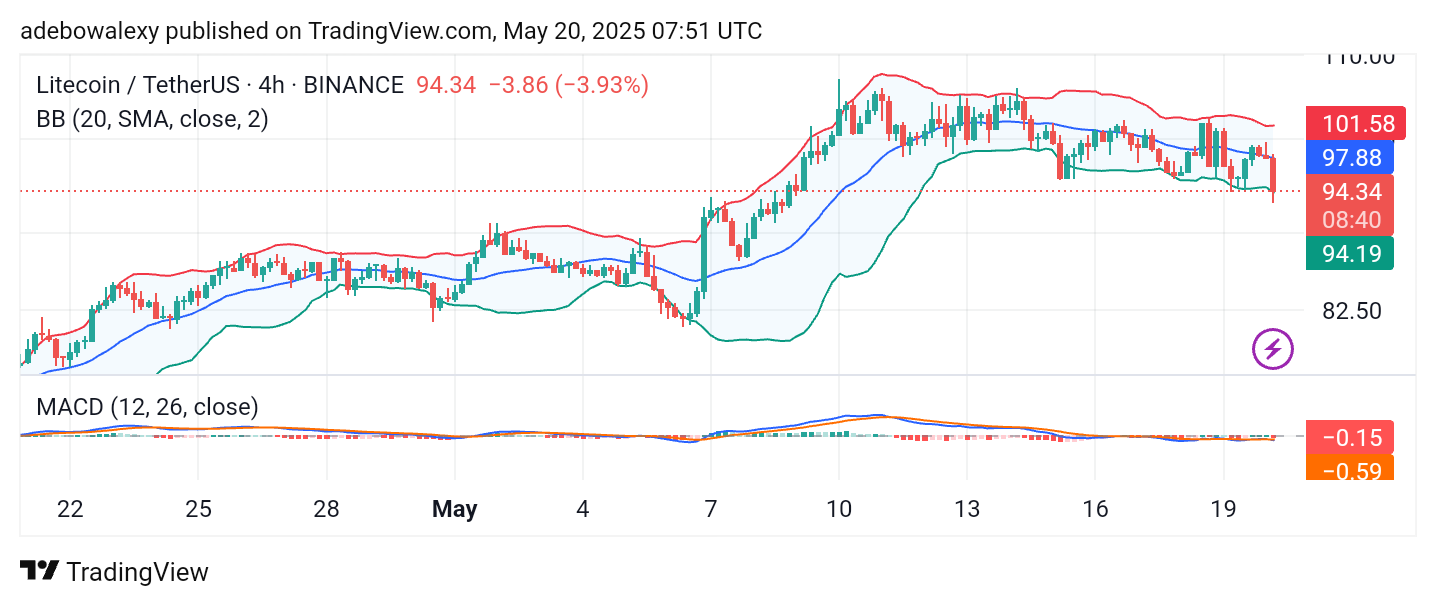
The lines of this indicator are currently merged and moving sideways, suggesting indecision. This merged appearance indicates that bullish forces are not yet ready to regain control. Consequently, this may allow bearish forces to push the market lower, potentially down to the $90 support level.