Dogecoin (DOGE) Price Prediction: DOGE/USDT Edges Lower
Estimated Reading Time: 3 minutes
Don’t invest unless you’re prepared to lose all the money you invest. This is a high-risk investment and you are unlikely to be protected if something goes wrong. Take 2 minutes to learn more

Date: May 19, 2025
Based on the position of the Dogecoin market seven days ago, it is evident that prices have edged lower. However, price activity remains above critical technical levels that, if breached, could be detrimental to bullish expectations.
DOGE/USDT Long-Term Trend: Bullish (Daily Chart)
Key Price Levels:
Resistance: $0.2500, $0.3000, $0.3500
Support: $0.2000, $0.1500, $0.1000
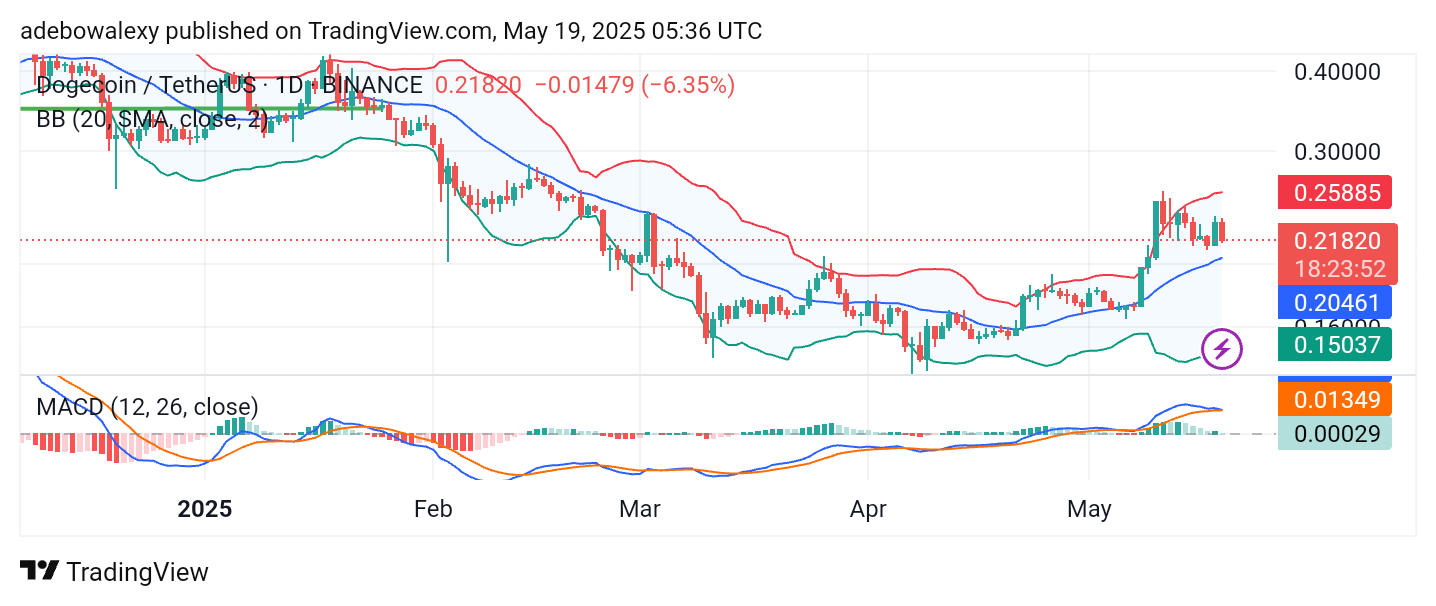
On the Dogecoin daily chart, price action has experienced a notable downward retracement in the ongoing session, as reflected by the most recent price candle. Nevertheless, trading remains above the midline of the Bollinger Bands, and the Bollinger Bands themselves retain a slight upward tilt. The Moving Average Convergence Divergence (MACD) lines are also positioned above the equilibrium level and appear to be converging sideways.
Dogecoin (DOGE) Price Prediction: DOGE/USDT Appears Burdened
Price activity in the Dogecoin market has continued to fluctuate between the upper and middle bands of the Bollinger indicator. However, a closer observation of the past seven days reveals that prices have edged slightly lower. This suggests a hovering or consolidating effect in price behavior.
As a result, price action remains above key support levels that may serve as a buffer against a strong downward retracement. Meanwhile, the MACD lines also remain above the equilibrium level. Though the terminals of this indicator are now pointing sideways, the market appears to lack a clear short-term direction.
Dogecoin (DOGE) Price Prediction: DOGE/USDT at Risk of Falling Further
In the 4-hour Dogecoin chart, price action has dipped just below the midline of the Bollinger Bands. Additionally, the Bollinger indicator is beginning to slope downward, signaling a shift in momentum.
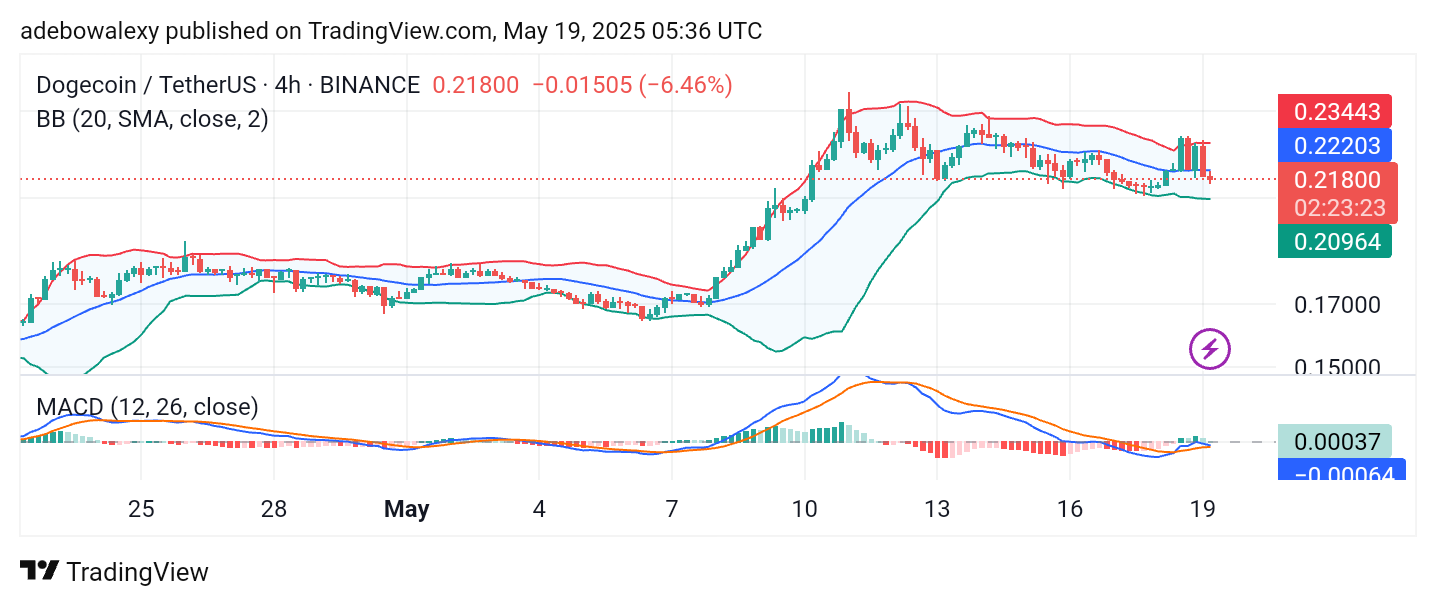
The MACD lines are now below the equilibrium level and are converging in preparation for a potential bearish crossover. These indicators together suggest that price action may continue to edge lower. Therefore, in light of the strong bearish signals currently present, traders should consider the possibility of the market declining toward the $0.2050 level.