Bitcoin (BTC) Price Prediction: BTC/USDT Nosedives Towards the $90K Threshold
Estimated Reading Time: 2 minutes
Don’t invest unless you’re prepared to lose all the money you invest. This is a high-risk investment and you are unlikely to be protected if something goes wrong. Take 2 minutes to learn more

Date: January 20, 2026
The Bitcoin market has started to see a strong downward retracement recently. Price action is now testing the $90,000 mark, and it is likely that the market may fall below this baseline.
BTC/USDT Long-Term Trend — Bullish (Daily Chart)
Key Price Levels
Resistance: $92,500, $95,000, $97,500
Support: $90,000, $88,000, $86,000
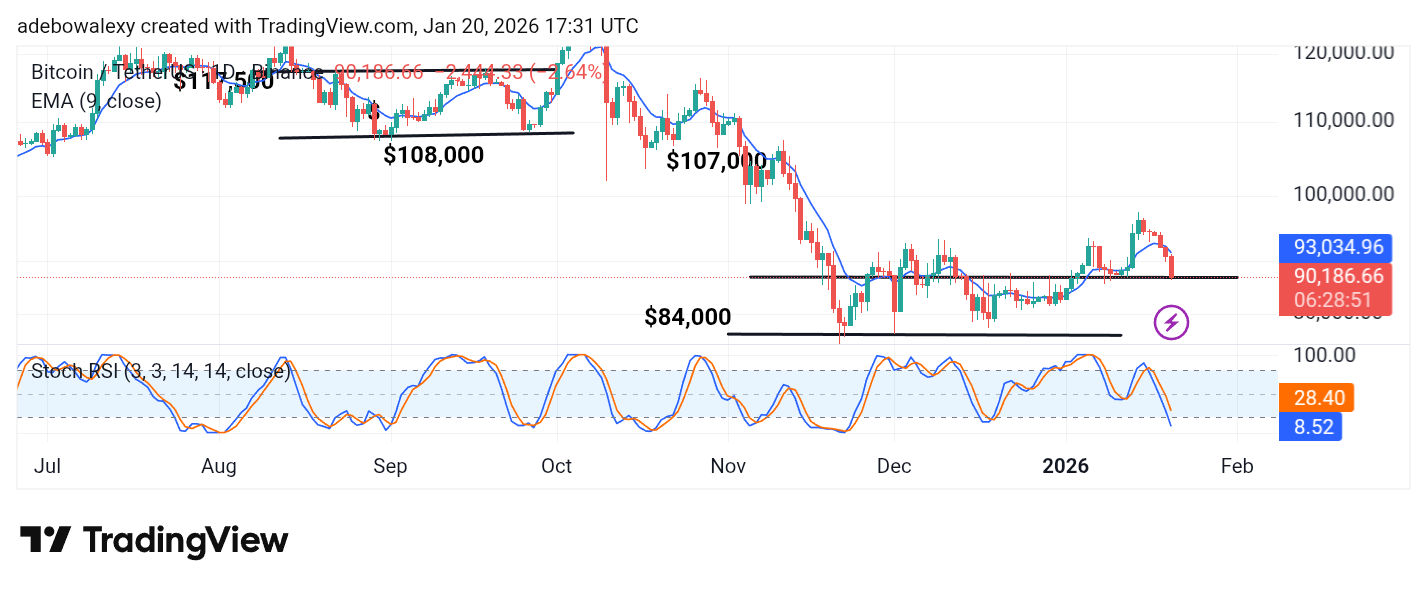
On the daily chart, it can be seen that headwinds have been dominant. Over the past five sessions to the current one, headwinds have prevailed as price action made a U-turn and is now testing the $90,000 threshold. The 9-day Exponential Moving Average (EMA) line now lies above the recently depreciated price candles. At the same time, the Stochastic Relative Strength Index (SRSI) indicator lines are falling sharply into the oversold region.
Bitcoin Price Prediction: BTC/USDT Falls Head First
Looking at the Bitcoin market, it can be observed that the applied technical indicators suggest one thing—that the market has a downward bias.
The 9-day EMA curve lies above price action, and the ongoing session places the current price far below the 9-day EMA curve. Simultaneously, the SRSI indicator lines are dropping sharply into the oversold region. As such, this market appears set for a downward path.
Bitcoin Price Prediction: BTC/USDT Keeps a Bearish Pose (4-Hour Chart)
Even on shorter time frames, the Bitcoin market keeps diving southward. The latest price candle can be seen testing support at the $90,000 level.
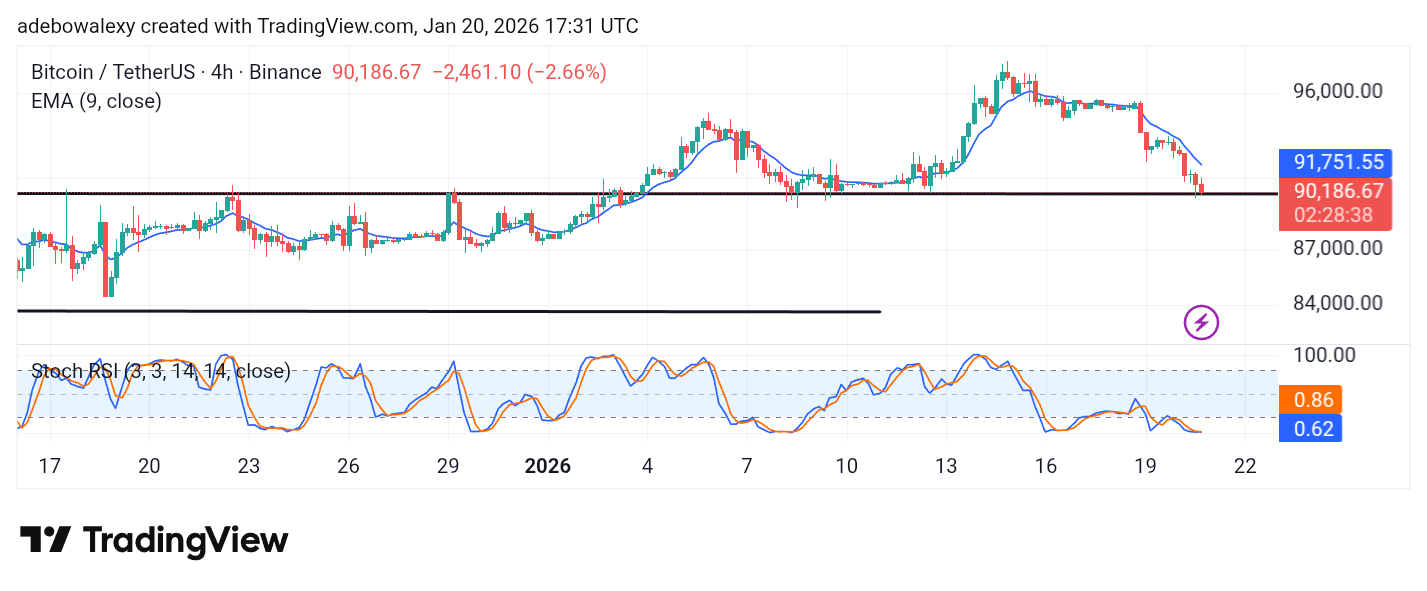
Consequently, this implies that price action remains below the 9-day EMA curve. Similarly, the SRSI indicator lines are still in the oversold region and appear to be preparing to linger there. This suggests that price action may proceed toward the $87,500 price level.