Bitcoin (BTC) Price Prediction: BTC/USDT Stays on Track Towards $90,000 Mark
Estimated Reading Time: 2 minutes
Don’t invest unless you’re prepared to lose all the money you invest. This is a high-risk investment and you are unlikely to be protected if something goes wrong. Take 2 minutes to learn more

Bitcoin (BTC) Price Prediction (April 15, 2025)
The Bitcoin market is gradually retracing its way toward higher price levels. As a result, price action has been testing the $85,000 level for a significant breakout. Let’s see how this market may proceed.
BTC/USDT Long-Term Trend: Bullish (Daily Chart)
Key Price Levels:
Resistance: $85,000, $90,000, $95,000
Support: $80,000, $75,000, $70,000
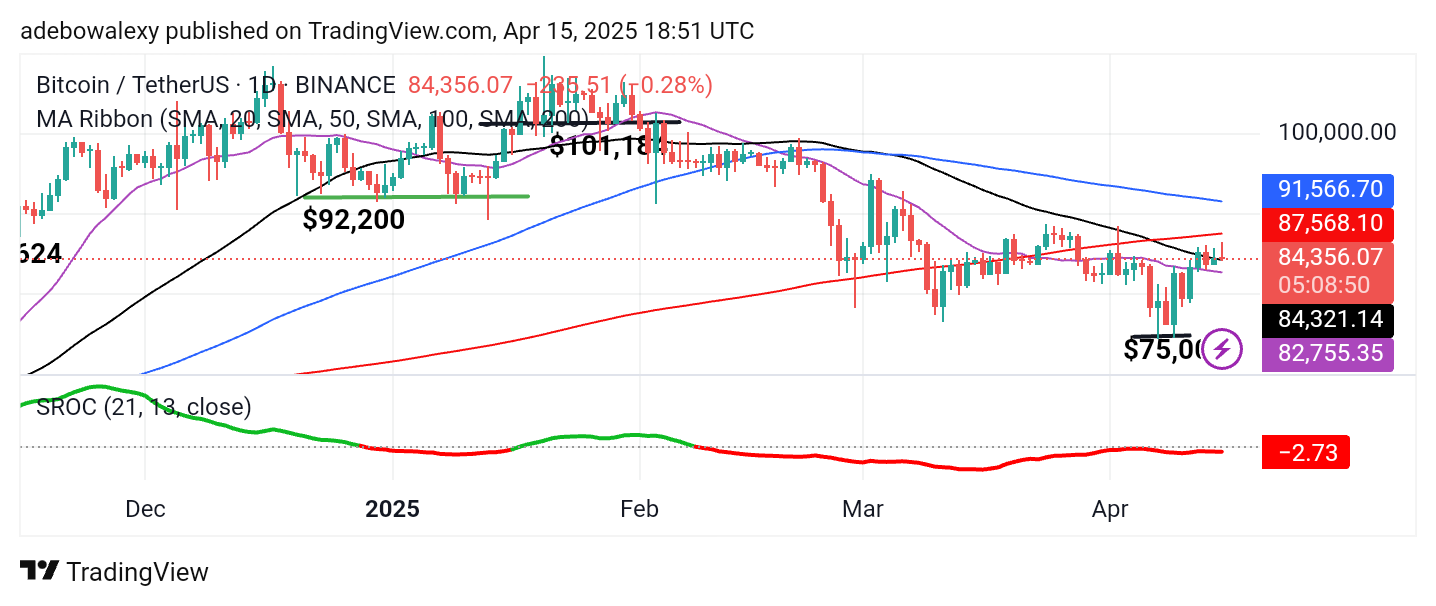
While the price action has risen above the 20- and 50-day Moving Average (MA) lines, the latest price candle on the chart has appeared red just above the 50-day MA curve. This candle has a downward-converging body, leaving an upper shadow. Meanwhile, the Stochastic Rate of Change (SROC) lines can be seen moving sideways just below the equilibrium level.
Bitcoin (BTC) Price Prediction: BTC/USDT Retains Foothold Above the 50-Day MA
Bitcoin’s price action has been steadily retracing higher ground. There have been a few pauses along the way, but the last price candle now stands just above the 50-day MA line. Consequently, the price of the token currently resides above two out of four MA lines.
Furthermore, the SROC indicator lines appear to be lurking just below the equilibrium level. This aligns with the last price candle and suggests that downward pressure is encountering strong support. However, traders may want to wait and see if this support level will hold.
Bitcoin (BTC) Price Prediction: BTC/USDT May Test the $84,000 Baseline
Looking at the 4-hour Bitcoin chart, it’s clear that the market has moved downward in the short term. Prices have been declining since the previous session, causing the market to retreat below the 200-day MA line. However, prices remain just above the $84,000 threshold.
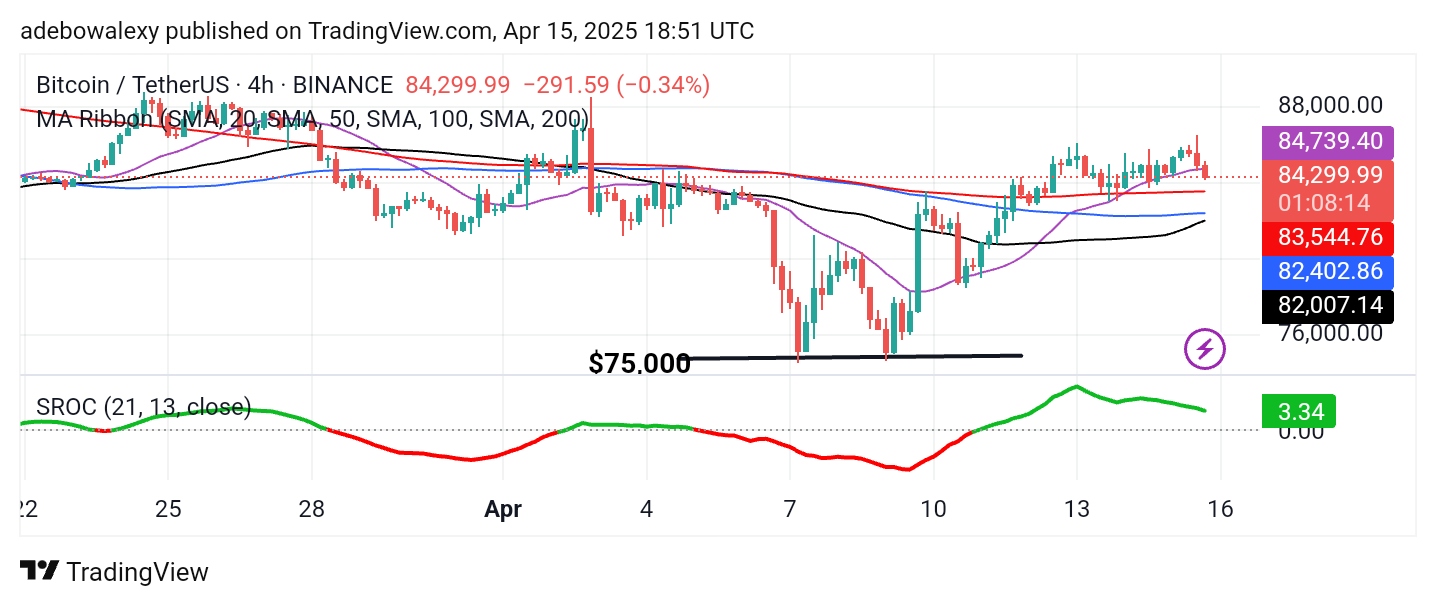
Meanwhile, the lines of the SROC indicator can be seen above the equilibrium level, although the trajectory appears to be slightly descending toward equilibrium. Given the momentum of the downward retracement in the latest price candle, price action may fall below the $84,000 level. However, the visible convergence of the 50- and 100-day MA lines suggests that price action may soon rebound positively.


