BNB (BNB/USDT) Faces Strong Sell-off; Struggles to Break Above $602
Estimated Reading Time: 3 minutes
Don’t invest unless you’re prepared to lose all the money you invest. This is a high-risk investment and you are unlikely to be protected if something goes wrong. Take 2 minutes to learn more
BNB Long-term Analysis: Ranging
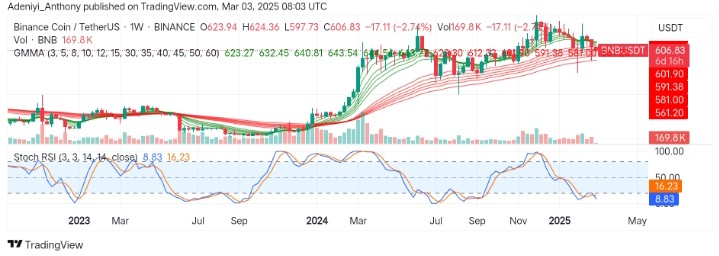
On a weekly timeframe, BNB against the Tether has experienced a bullish rally in the previous months, after which the price faced rejection around the $640 upper limit. This suggests the price is currently in a pullback as the pair struggles to hold at a value above $602.
Currently, BNB is in a downtrend, moving below the $610 despite an intact long-term uptrend structure. To this end, continued recent price movement may lead toward the lower support where a re-entry opportunity lies for the bullish traders.
Currently, BNB trades at $606.83, with a moderate 169.8 thousand traded volumes for the week.
Technical Analysis
Major Resistance Levels: $623.27, $632.45, and $650.00
Major Support Levels: $601.90, $580.00, and $560.00
BNB Technical Analysis
The analysis of the BNB against the Tether on a weekly chart shows that the pair is currently retracing after seeing a significant move to the north.
The Guppy Multiple Moving Averages (GMMAs) suggest the pair maintains a bullish long-term outlook. However, the short-period EMAs appear to be converging towards the long-period EMAs, suggesting ongoing bearish market activities.
On the other hand, the Stochastic RSI suggests an oversold condition as the lines read below the 20-mark level. Therefore, a bounce may be expected if buyers step in.
To this end, the pair may see further downside movement if the $601.90 support level fails to hold.
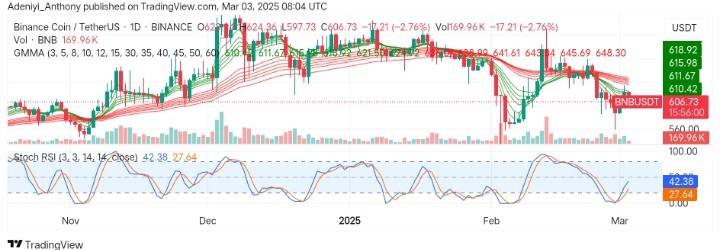
BNB/USDT Analysis: A Short-term Bounce in View
The analysis of the BNB/USDT on the daily timeframe shows that the pair is currently testing key support at $602 as the price records a loss of 2.76%. Though the GMMAs slope downwards, the flattened long-period EMAs indicate that a possible reversal may be near.
On the other hand, the Stochastic oscillator signals an impending short-term upside movement as the lines improve to the north. To this end, with an improvement above the 50-mark level, a reversal may be confirmed if bullish volumes increase for a push toward the $623 resistance level.
You can purchase crypto coins here. Buy LBlock