BNB Price Navigates Critical Demand: Can the $600 Floor Halt the Bearish Slide?
Estimated Reading Time: 3 minutes
Don’t invest unless you’re prepared to lose all the money you invest. This is a high-risk investment and you are unlikely to be protected if something goes wrong. Take 2 minutes to learn more
In line with the overall market decrease, the BNB price has dropped 1.96% to $618.13 during the past day. Currently, this seems to be a selling pressure driven by beta that is directly related to the 2.04% decline in Bitcoin. Given that the greed and fear indicator is at 12, this indicates a general risk-averse attitude among investors.
Bitcoin has to establish strong support around $68,000 in the near future; if not, it might undergo a more severe fall and possibly revisit the February low of $580.
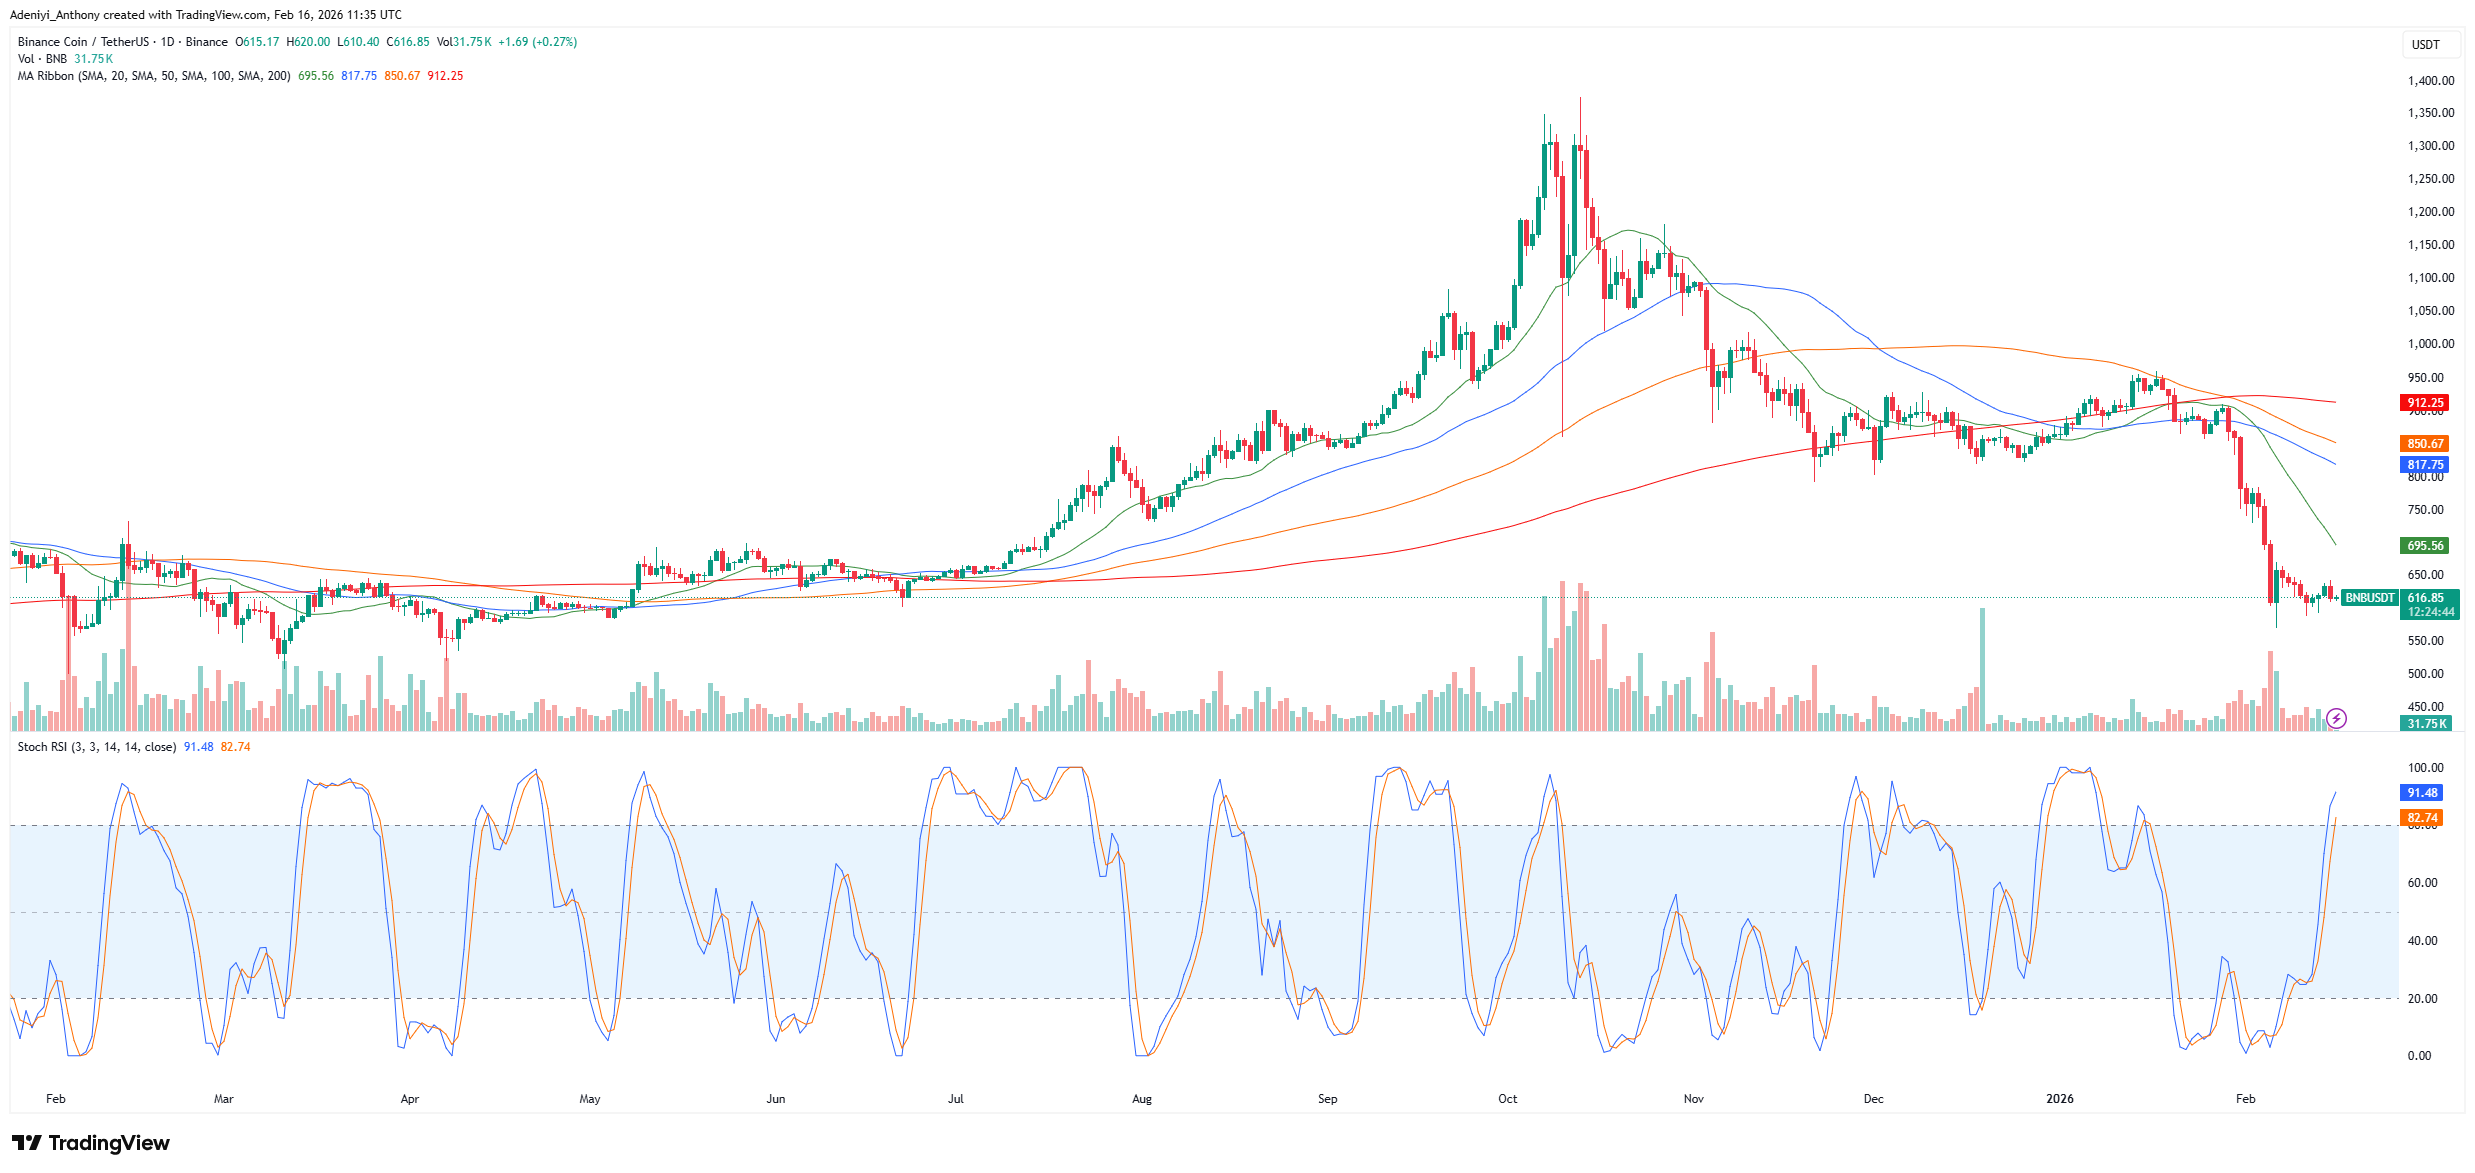
Currently, BNB trades at $616.85 with more than 31k traded volumes on the daily timeframe.
Technical Indicators
Major Resistance Levels: $632, $650, and $730
Major Support Levels: $600, $570, and $530
Technical Analysis
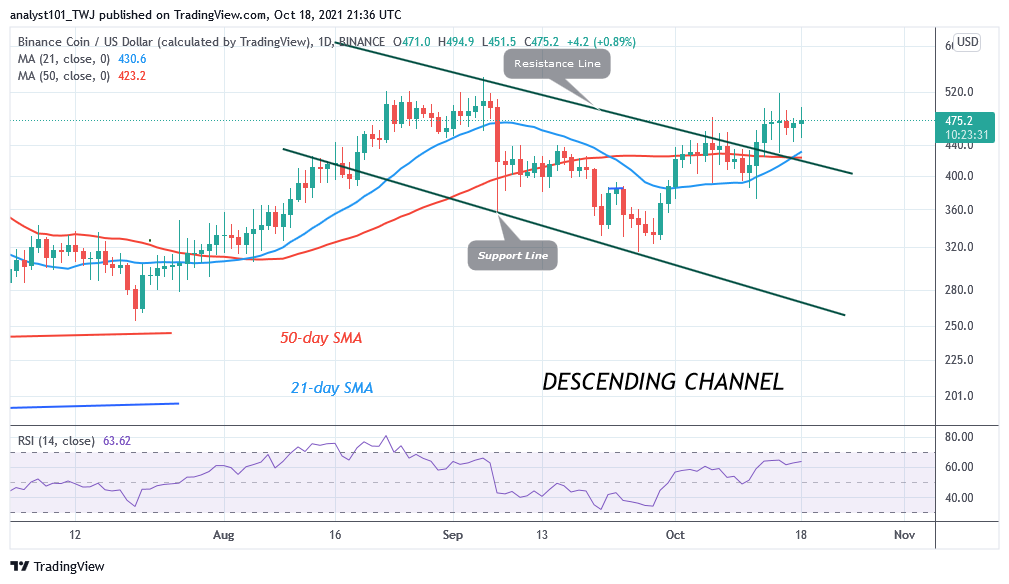
The current market sentiment for BNB against Tether is navigating a serious Strong Sell technical situation across short-to-medium timeframes. This appears to have started after a sharp decline from its October 2025 highs. The BNB price is currently navigating a descending channel and stabilizing around the $610–$620 zone. However, though the long-term outlook remains cautiously optimistic due to ecosystem utility, the Stochastic RSI (SRSI) suggests an impending downside movement is on the horizon as the lines extend into the extreme overbought zone without significant changes in the price.
To this end, if the $600 psychological level fails to hold, $570 may be the next target; conversely, a move above $632 would invalidate this analysis.
BNB Tanking: $545 Target in View
In recent times, BNB has remained bearish across different timeframes. The hourly chart shows rejection from oversold levels; meanwhile, the daily chart faces resistance at the 5-day moving average. As it stands, the weekly and monthly indicators reflect downward momentum and worsening MACD histograms. This shows the BNB price is projected to drop toward the $545 and $513 price targets, except if market fundamentals change.
BNB Price Slump Hits a Wall: Reversal or Just a Pitstop?
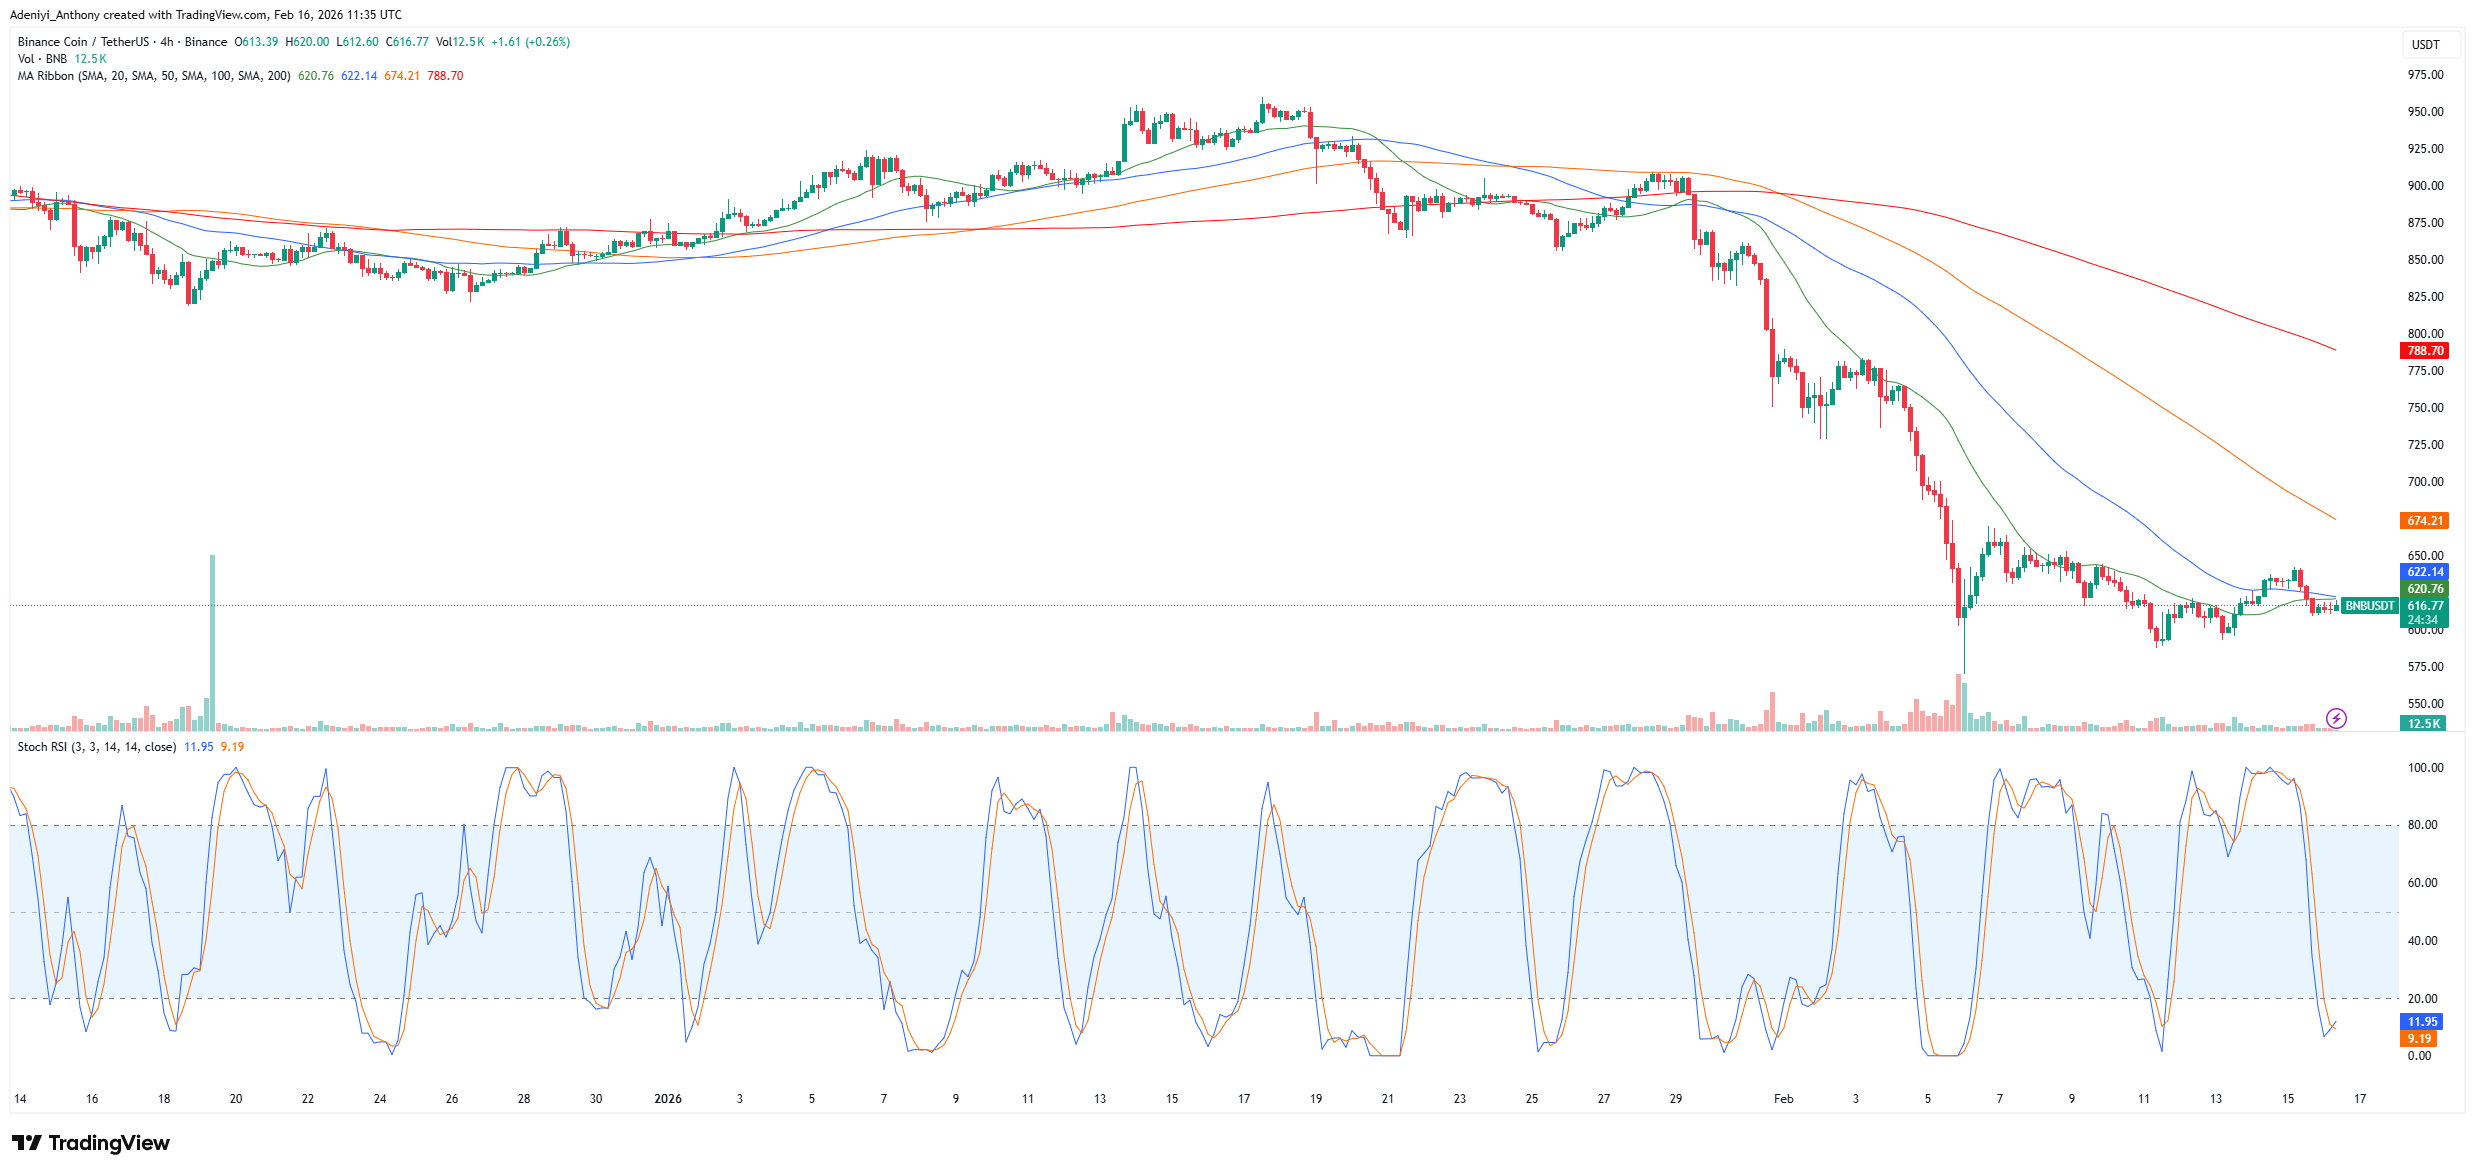
After a sharp downward move, BNB/USDT on the 4-hour chart shows the pair is near a local support zone, attempting to hold above the zone. However, the BNB price is still below the cluster of moving averages acting as dynamic resistance, especially the $620 level.
Beneath the chart, the Stochastic RSI appears to be suggesting increased optimism about the token. As it stands, the lines are currently at the bottom of the range, indicating an oversold condition. However, a bullish crossover has been spotted, giving out an early signal that the downward momentum is exhausting and a relief rally or reversal is likely. To this end, a move above $622 would open the path to the $674 resistance zone; otherwise, a continued downtrend might be seen.
You can purchase crypto coins here. Buy Crypto