BNB Surpasses the Barrier at $370 as It Challenges the Recent High
Estimated Reading Time: 2 minutes
Don’t invest unless you’re prepared to lose all the money you invest. This is a high-risk investment and you are unlikely to be protected if something goes wrong. Take 2 minutes to learn more

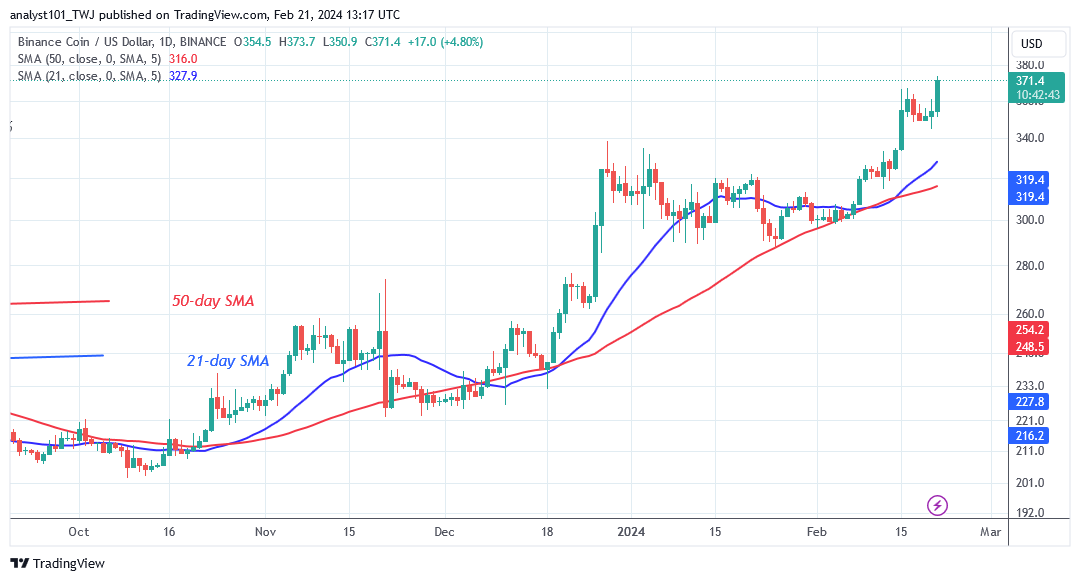
BNB (BNB) Long-Term Analysis: Bullish
BNB’s price is trading above the moving average lines as it challenges the recent high. On February 16, the bulls overcame the previous sideways trend and the $340 barrier level. The cryptocurrency is currently worth $383. The present bullish momentum has overcome the resistance at $370. BNB is rising as buyers surpass the $370 barrier level.
The altcoin will reach a high of $400. If the bullish scenario is invalidated, the cryptocurrency asset will be forced to trade sideways below its recent high. Meanwhile, BNB/USD is trading above its previous high of $370.
Technical indicators:
Major Resistance Levels – $440, $460, $480
Major Support Levels – $240, $220, $200
BNB (BNB) Indicator Analysis
The price bars of BNB move above and below the 21-day $MA before the price rebound. The current price range has been shattered as the altcoin reached a new high. The moving average lines are sloping northward, with a bullish crossover. That is the 21-day SMA crossing above the 50-day SMA, suggesting bullish indications for traders.
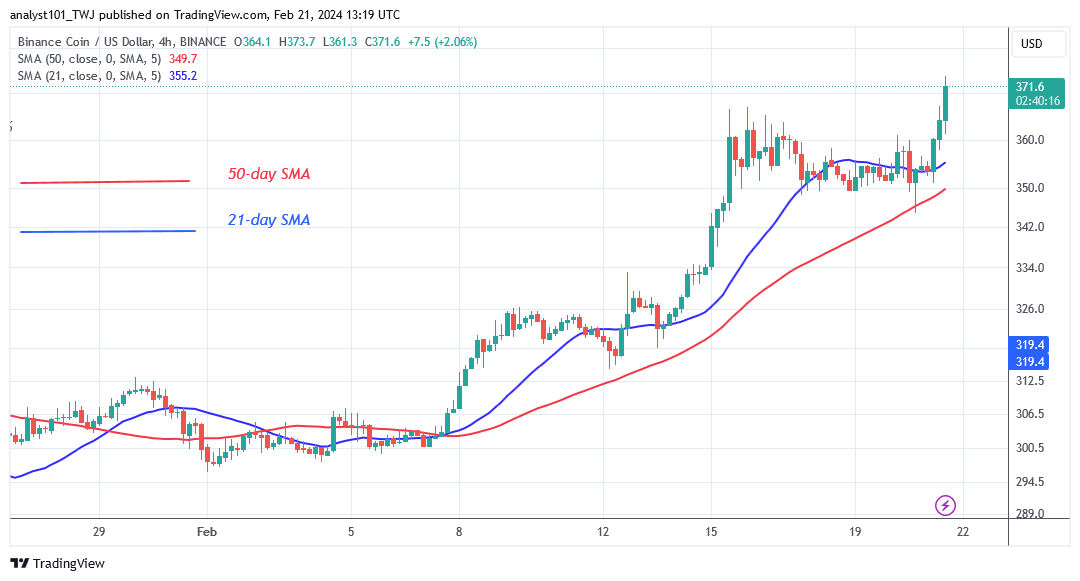
What Is the Next Direction for BNB (BNB)?
BNB/USD has recovered bullish momentum as it challenges the recent high. On the 4-hour chart, the cryptocurrency asset is bouncing below the $360 barrier level before the price breakout. The bullish momentum has been seamless, as there are no price barriers. The crypto signal is bullish as buyers plan to push the altcoin to a high of $400.
You can purchase Lucky Block here. Buy LBLOCK
Note: Cryptosignals.org is not a financial advisor. Do your research before investing your funds in any financial asset or presented product or event. We are not responsible for your investing results