BNB Veers Sideways as It Holds above the $300 Support
Estimated Reading Time: 2 minutes
Don’t invest unless you’re prepared to lose all the money you invest. This is a high-risk investment and you are unlikely to be protected if something goes wrong. Take 2 minutes to learn more
BNB (BNB) Long-Term Analysis: Bearish
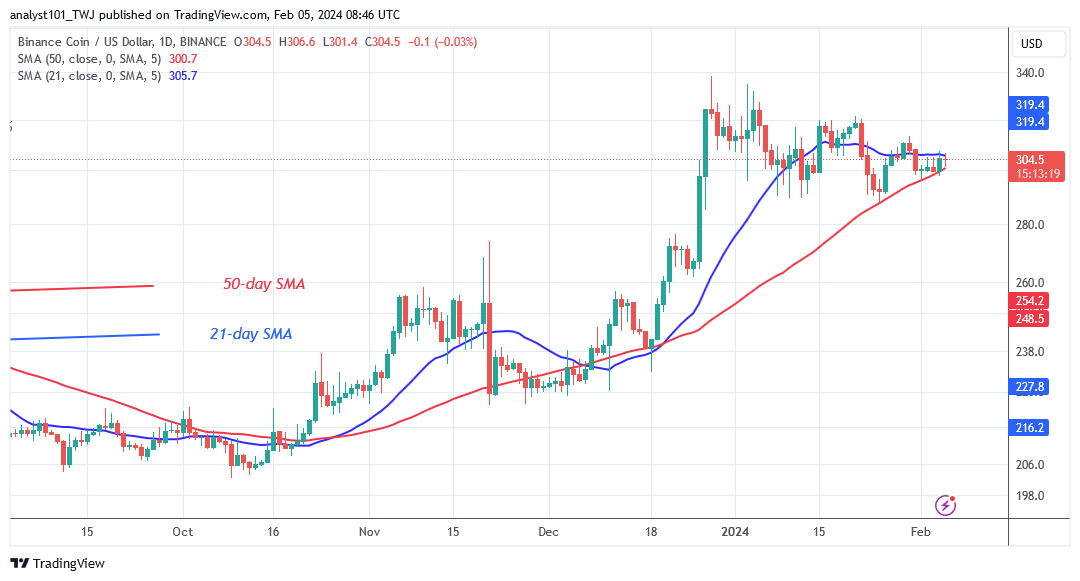
BNB’s price is caught between the moving average lines as it holds above the $300 support. In other words, the cryptocurrency is trading in a narrow range between $290 and $330. The altcoin is still trapped between the moving average lines, despite the fact that upward moves have stopped below the $310 barrier level. BNB is now in a tight range, with the possibility of a breakdown or rebound.
Doji candlesticks have caused the price movement to become motionless. A price breakdown below the 50-day SMA will send the altcoin down to lows of $290 and $270. A price rebound above the $300 support level will restart the altcoin’s upward ascension. BNB will rise to a high of $330. It is now worth $303 at the time of writing.
Technical indicators:
Major Resistance Levels – $440, $460, $480
Major Support Levels – $240, $220, $200
BNB (BNB) Indicator Analysis
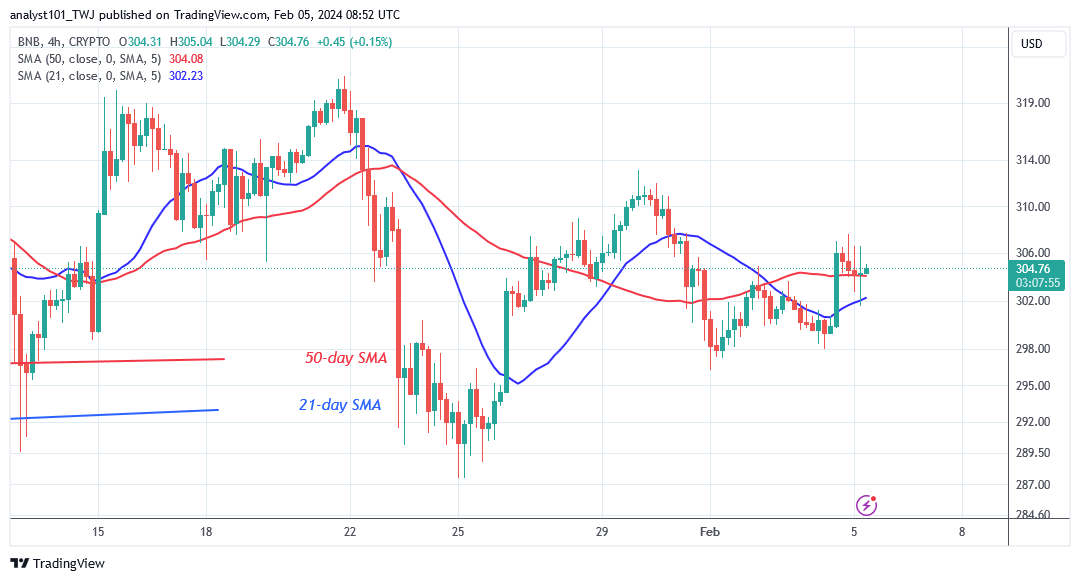
The price bars have remained flat between the moving average lines.BNB may see a breakdown or breakout as it continues to consolidate. The price action shows the presence of Doji candlesticks, which have kept the coin in a range.
What Is the Next Direction for BNB (BNB)?
BNB/USD is consolidating above 50-day SMA as it holds above the $300 support. The altcoin is now trading within a limited range of $290 to $310. The price movement has been static. The price bars feature Doji candlesticks with lengthy tails and wicks, which inhibit price movement. This has caused the crypto signal to remain range-bound since December 28.
You can purchase crypto coins here. Buy LBLOCK
Note: Cryptosignals.org is not a financial advisor. Do your research before investing your funds in any financial asset or presented product or event. We are not responsible for your investing results