BNB’s Slide Subsides As It Resumes Oscillating Above $290
Estimated Reading Time: 2 minutes
Don’t invest unless you’re prepared to lose all the money you invest. This is a high-risk investment and you are unlikely to be protected if something goes wrong. Take 2 minutes to learn more

BNB (BNB) Long-Term Analysis: Bearish
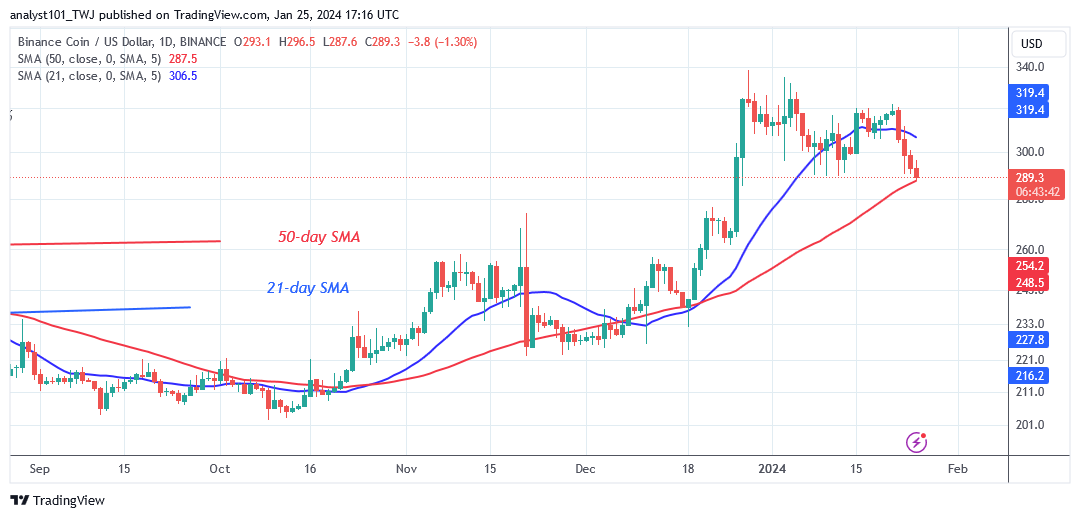
BNB’s price has been caught between the moving average lines as it resumes oscillating above $290. The selling pressure has subsided, as the altcoin remains above the 50-day SMA or $290 support. The cryptocurrency’s price is likely to fluctuate while it remains above the 50-day SMA. BNB is surging to the upside.
The cryptocurrency asset will resume a bullish trend if buyers sustain the price above the 21-day SMA. The positive momentum will continue and return to the previous highs of $330 and $340. However, the current oscillations will continue if buyers fail to maintain their bullish ascent above the 21-day SMA. In other words, the altcoin will trend if the price crosses the moving average lines.
Technical indicators:
Major Resistance Levels – $440, $460, $480
Major Support Levels – $240, $220, $200
BNB (BNB) Indicator Analysis
Since January 22, BNB’s price has remained caught between the moving average lines. The altcoin’s price is restricted between the moving average lines. The altcoin will rise or decrease depending on whether the moving average lines are broken.
What Is the Next Direction for BNB (BNB)?
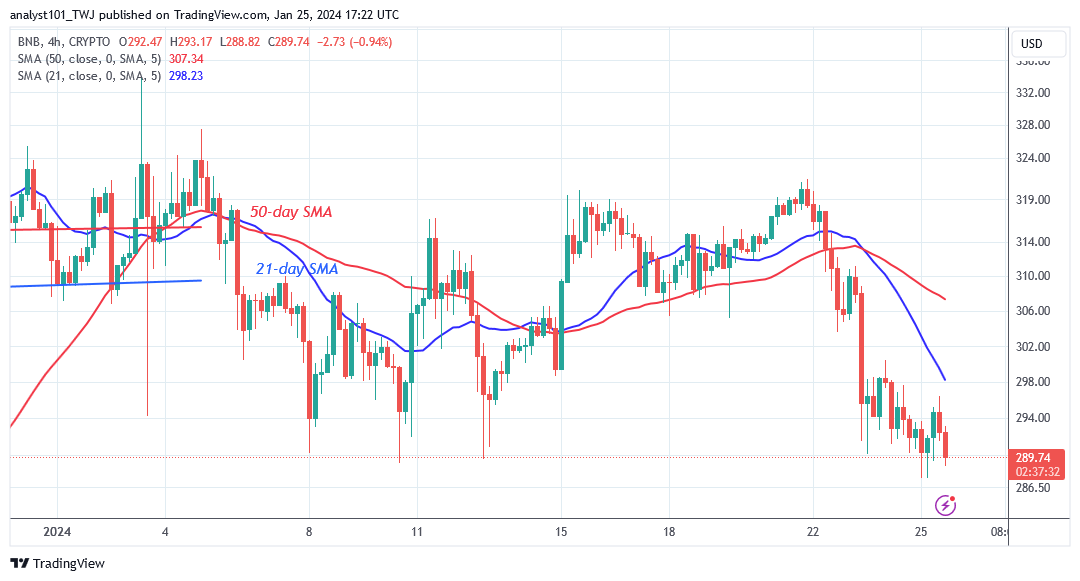
BNB/USD rebounds from its drop as it resumes oscillating above $290. On the 4-hour chart, the altcoin’s price fluctuates between $290 and $298. The coin is increasing, but the gains are being capped by the 21-day SMA or the barrier at $298. Meanwhile, bearish crypto signals have eased as the altcoin has remained above the $290 support level.
You can purchase crypto coins here. Buy LBLOCK
Note: Cryptosignals.org is not a financial advisor. Do your research before investing your funds in any financial asset or presented product or event. We are not responsible for your investing results