Cardano (ADA/USDT) Experiences a Pullback Around $1.0000 Level
Estimated Reading Time: 3 minutes
Don’t invest unless you’re prepared to lose all the money you invest. This is a high-risk investment and you are unlikely to be protected if something goes wrong. Take 2 minutes to learn more
Cardano Long-term Analysis: Ranging
The market for Cardano against the Tether towards the end of 2024 has experienced a strong bullish push with significant moves over and above a series of resistance levels due to increasing buying volume.
However, the pair seems to be experiencing a pullback as the price decreases by 0.78% after reaching a peak close to the $1.0000 level. This may suggest a potential retracement phase is on the horizon, as traders await solid confirmation.
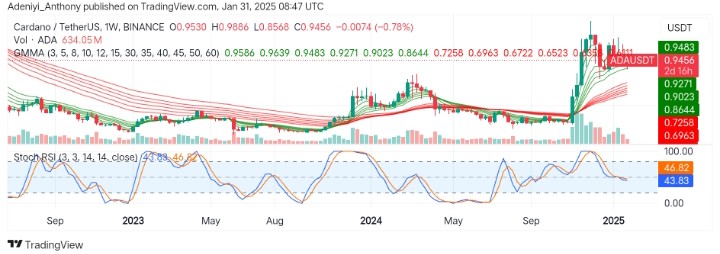
Currently, Cardano trades at $0.9456, recording 634.05 million volumes for the week.
Technical Indicators
Major Resistance Levels: $0.9886, $1.0500, and $1.2000
Major Support Levels: 0.9271, $0.9023, and $0.8644
Cardano Technical Analysis
Over the past seven sessions on the weekly timeframe, Cardano against the Tether has witnessed a significant breakout, with a local high at $0.9886. Though the current retracement is minor, this shows the bulls are still in control.
The Guppy Multiple Moving Averages (GMMAs) display a classic bullish crossover, indicating sustained momentum despite a minor pullback. This shows the trend is still intact as long as the green and red EMAs maintain their current position.
On the other hand, the Stochastic RSI points downward, suggesting the market may be cooling off with consolidation in view. However, if the oscillator reaches the 20-mark level, more opportunities could be opened to the bullish traders.
To this end, sustaining the current position above $.9456, with a move above $0.9886 might push Cardano towards $1.0500 or above. Conversely, a break below $0.9023 would trigger a correction towards $0.8644 before regaining strength.
ADA/USDT Analysis: Expectations
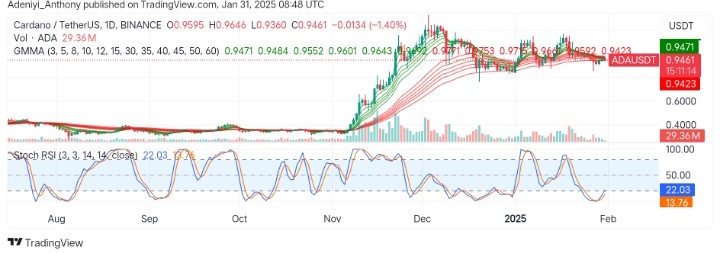
On the daily chart, ADA/USDT appears to be consolidating, portraying the likely struggle between the bulls and bears. The GMMAs signal the bulls are still in control as the price sits above $0.9023.
The Stochastic RSI, on the other hand, captures the behavior of the pair’s price as the lines read slightly below the 50-mark level, suggesting indecision among traders.
To this end, all indicators support more upside movement, and suspension above $0.9271 would bring about a trade above $1.0500 in no time. Conversely, failure to hold above $0.9023 could push the price toward $0.8644 with increased selling pressure.
You can purchase crypto coins here. Buy LBlock


