Cardano (ADA/USDT) Targets a Fresh Start—A Bullish Breakout in the Making?
Estimated Reading Time: 3 minutes
Don’t invest unless you’re prepared to lose all the money you invest. This is a high-risk investment and you are unlikely to be protected if something goes wrong. Take 2 minutes to learn more
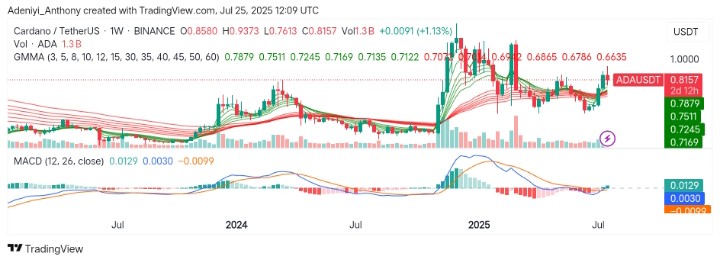
ADA/USDT Long-term Analysis: Ranging
The market for Cardano against Tether has shown signs of potential for bullish momentum. However, the recent price action indicated a push to the north, with a sharp rally in early 2025 followed by a tight range movement.
As it stands, the pair is currently exhibiting sideways movement. This suggests a potential for another breakout, but this would depend on the continuation of the bullish trend.
Currently, Cardano trades at $0.8157 with 1.3 billion in traded volumes for the week.
Technical Indicators
Major Resistance Levels: $0.8580, $0.9373, and $1.000
Major Support Levels: $0.7613, $0.7245, and $0.7072
Cardano Technical Indicators
The analysis of Cardano against the Tether on a weekly timeframe shows the Guppy Multiple Moving Averages (GMMA) has displayed a clear uptrend with short-term moving averages above the long-term ones. However, the green and red lines suggest activeness in the market despite the recent curve in the green EMA signaling a pullback that may continue until the short-term moving averages cross below.
On the other hand, the MACD (Moving Average Convergence Divergence) has shown a strong bullish cross earlier this year and is now in a slightly overbought state. To this end, the MACD histogram is positive, indicating the continuation of upward momentum. However, given the current condition ADA is at a critical juncture, and a break above the $0.8580 resistance for confirmation of continued upward movement is needed. If it fails to break this level, a pullback towards support could offer a better entry point.
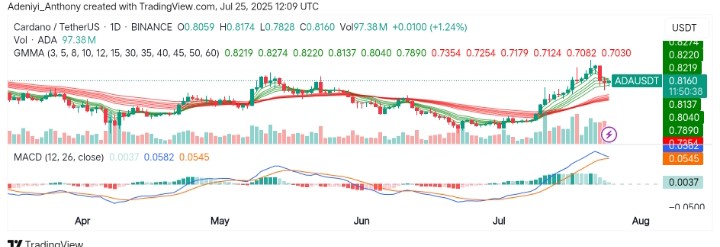
ADA/USDT Analysis: Building Momentum for Continued Upside
On the daily chart, the analysis of ADA/USDT shows the pair is bullish, supported by the increasing volume. The GMMA suggests a continued uptrend, with short-term moving averages well above the long-term ones, signaling sustained bullish sentiment.
However, the MACD beneath the chart is still in the positive territory, with the histogram showing an increase in momentum. This indicates that the bullish trend is likely to continue in the near term, as ADA surpassed resistance at 0.8040 and is now attempting to stabilize above this level.
To this end, the next major resistance level is $0.8137, followed by $0.8200, both of which are crucial for confirming the uptrend. However, support levels are at $0.7890, which becomes a level for potential pullbacks.
You can purchase crypto coins here. Buy LBlock