Cardano (ADA/USDT) Targets Immediate Resistance Amid Rising Momentum
Estimated Reading Time: 3 minutes
Don’t invest unless you’re prepared to lose all the money you invest. This is a high-risk investment and you are unlikely to be protected if something goes wrong. Take 2 minutes to learn more

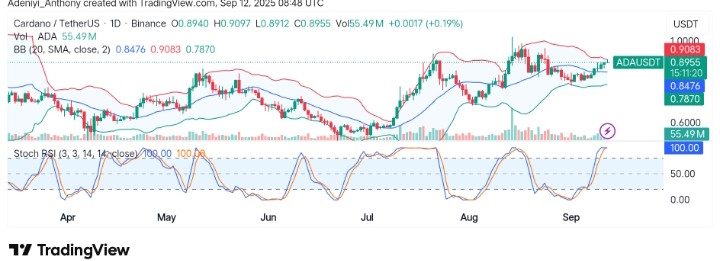
Cardano against Tether has been on a bullish trajectory recently, showing an upward momentum from its lower range to break near the upper Bollinger band.
Recently, the pair’s price action suggests a positive sentiment with an inclination toward a continued upward move. From another angle, this upside move comes amid ongoing volatility, with the Bollinger Bands and Stochastic RSI indicating potential resistance is near.
To this end, the pair is strongly overbought, and a cautious approach is required, though volume appears to be on the increase.
Currently, Cardano trades at $0.8955 with over 55 million daily traded volumes.
Technical Indicators
Major Resistance Levels: $0.9037, $0.9500, and $1.0000
Major Support Levels: $0.8476, $0.7870, and $0.7500
Cardano Technical Analysis
Technically, Cardano’s position above the 20-period moving average shows the coin is currently bullish. However, the proximity of the price to the upper Bollinger Bands raises concerns, as the coin’s value needs to break above $0.9083 to confirm continuation towards a higher level.
Also, the Stochastic RSI, which operates at 100, shows massive participation but signals a corrective pullback might be on the way before recording a new high.
To this end, Cardano against Tether must build a strong base around the $0.8500 level for a move near $1.000 in the coming session.
Cardano Still on $2 Breakout?
In recent times, Cardano has been maintaining a stance above micro support at $0.8100, hoping for a break above immediate resistance. A drop from this position may lead to a retest of previous support, but a move above $0.920 will reduce the probability of a pullback.
ADA/USDT Analysis: Maintaining a Bullish Structure
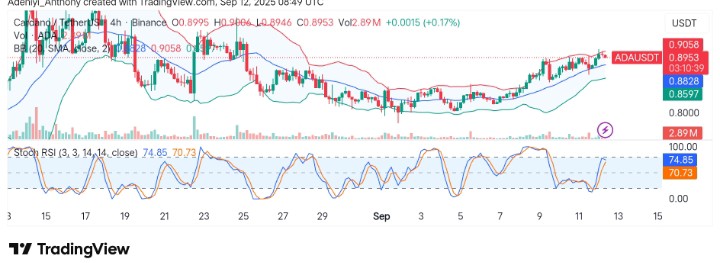
The 4-hour chart for ADA/USDT reflects significant momentum as the price hovers near the upper Bollinger Band, signaling a strong bullish sentiment. The Stochastic RSI seems to be approaching overbought conditions at 74.85, which suggests that ADA could be nearing a short-term resistance test, but the curvature of the blue line suggests the pair is currently on a corrective pullback.
Though the volume appears consistent, confirming the bullishness, the immediate price action is testing the $0.9058 resistance level, and if it breaks through, further upward movement is likely.
To this end, if ADA faces rejection at the projected upper limit, a slight pullback to the $0.8597 levels could offer potential support, provided volume remains supportive.
You can purchase crypto coins here. Buy Crypto