ChainLink (LINK/USDT) Faces $15.64 Resistance as Price Consolidates
Estimated Reading Time: 3 minutes
Don’t invest unless you’re prepared to lose all the money you invest. This is a high-risk investment and you are unlikely to be protected if something goes wrong. Take 2 minutes to learn more

In the last 24 hours, Chainlink against Tether has fallen by 2.7%, going beyond the broader market’s poor performance of 0.8%. This can be attributed to the previous move below $15.26, crypto-wide risk-off sentiment, and conflicting signals from the long-term and scalpers.
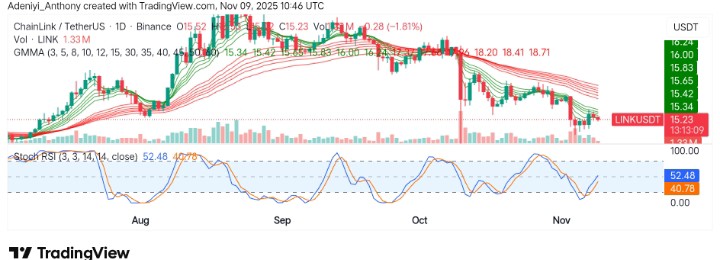
However, at the moment, the pair is still exhibiting a downward movement as seen with the direction of the Guppy Multiple Moving Averages (GMMA) and the mixed signals of the Stochastic RSI on the daily timeframe.
Currently, Chainlink trades at $15.23 with more than 1.33 million daily traded volumes.
Technical Indicators
Major Resistance Levels: $15.64, $17.27, and $21.30
Major Support Levels: $15.00, $14.52, and $13.80
Technical Analysis
Technically, Chainlink against Tether has been on a prolonged downtrend for far too long. The pair appears to have been facing stronger resistance each time an upside move is to be made. The GMMA on the daily chart shows that the selling pressure is strong as the clusters of exponential moving averages tend southeast.
Meanwhile, the Stochastic RSI visibly shows a different signal; it appears that the momentum oscillator is pointing to a renewed upside short-term move.
To this end, the pair needs to break above $15.64 for a confirmed upside reversal; otherwise, a move below $15.00 might denote a dip towards $13.80 in the coming session.
ChainLink Next Move
On the larger timeframe, Chainlink seems to be reacting slightly to immediately support around $15.00. However, it appears that the token wants to make a 2-wave down but is struggling with that, as no impulsive move to the upside has formed. For now, the pressure remains downward; meanwhile, no continuation pattern towards this direction has been formed yet.
LINK/USDT Analysis: Seeking Direction; What’s Next?
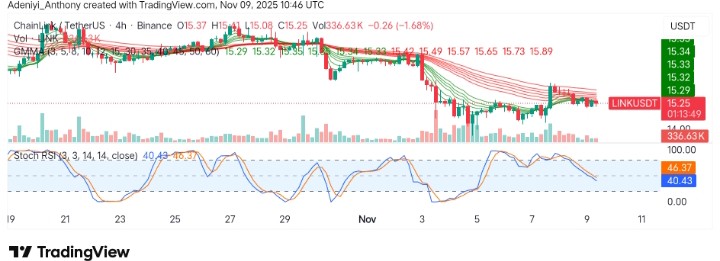
On the shorter timeframe, LINK/USDT happens to be moving around a spot despite recent efforts to break to the upside, as seen with the reaction of the GMMA and the Stochastic RSI.
As it stands, the momentum oscillator points to falling bullish momentum with the lines moving into the oversold region, and as stated earlier, a move below $15.00 would indicate a move back to the regions tested during the crypto-wide fall in October.
You can purchase crypto coins here. Buy Crypto