ChainLink (LINK/USDT) Poised for Bullish Move Despite Overbought Conditions
Estimated Reading Time: 3 minutes
Don’t invest unless you’re prepared to lose all the money you invest. This is a high-risk investment and you are unlikely to be protected if something goes wrong. Take 2 minutes to learn more

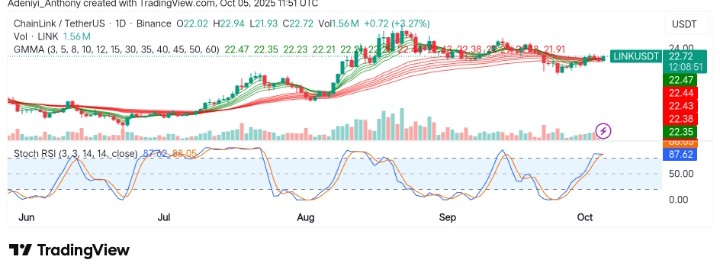
ChainLink against Tether appears positive with a bullish trend that has been strong since early July. As demonstrated by the consistent movement above the Guppy Multiple Moving Average (GMMA) lines with an extreme value Stochastic RSI, the pair appears poised for further uptrend.
Recently, the price has been fluctuating around $22.38, stuck between $22.39 and $22.85 after a strong upward movement. At the moment, the stochastic RSI is indicating that we might see a period of consolidation or a minor fall in value before further upswing. However, the strength of the bullish trend is evident as the price has held above key support levels, which suggests that it may still be in an upward trend unless significant bearish signals appear.
Currently, ChainLink trades at $22.72, moving more than 3% upside in the last 24 hours with more than 1.56 million traded volumes.
Technical Indicators
Major Resistance Levels: $22.94, $23.50, and $23.80
Major Support Levels: $22.46, $21.91, and $21.50
ChainLink Technical Analysis
ChainLink against Tether, technically, is still holding above key moving averages, particularly the GMMA lines. However, the overbought condition in the Stochastic RSI signals that a short-term correction or consolidation phase might occur. This could present a good opportunity to enter long positions at lower levels, closer to the support levels mentioned.
To this end, the $22.46 presents a good spot for a long position; otherwise, a break below the next support would initiate a longer correction.
LINK/USDT Analysis: Ready for an Upside Move?
ChainLink against Tether on the 1H chart has been struggling following Bitcoin’s recent dominance, as major altcoins appear to be holding onto support levels. As of now, the token appears to be operating in an ascending channel, and it needs to break above $22.46 and $21.42 support for a continued upside move above the trend line.
LINK/USDT Analysis: What’s Next for LINK?
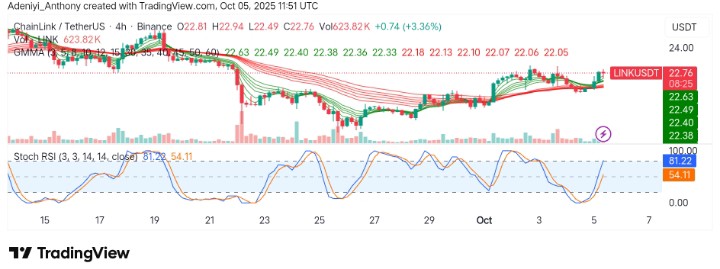
LINK/USDT on the 4-hour chart is showing a clear rebound after a brief consolidation phase. The Stochastic RSI, on the other hand, is currently at 81.22, indicating that LINK/USDT is in an overbought region. This suggests a potential for a slight pullback before any uptrend continuation.
However, the GMMA, on the other hand, appears to be in support of the bullish stance, with the positioning of the short-period EMAs above the long-period EMAs, signifying strong momentum.
For that reason, a probable retreat to critical support zones such as $22.39 before evaluating further long positions is possible. Though the recent breakout above the $22.67 resistance level is a powerful signal, the pair’s upward trend should be viewed with caution.
You can purchase crypto coins here. Buy Crypto