Curve (CRV/USD) Falls Just Shy of $0.500 but Establishes Solid Ground Below
Estimated Reading Time: 3 minutes
Don’t invest unless you’re prepared to lose all the money you invest. This is a high-risk investment and you are unlikely to be protected if something goes wrong. Take 2 minutes to learn more
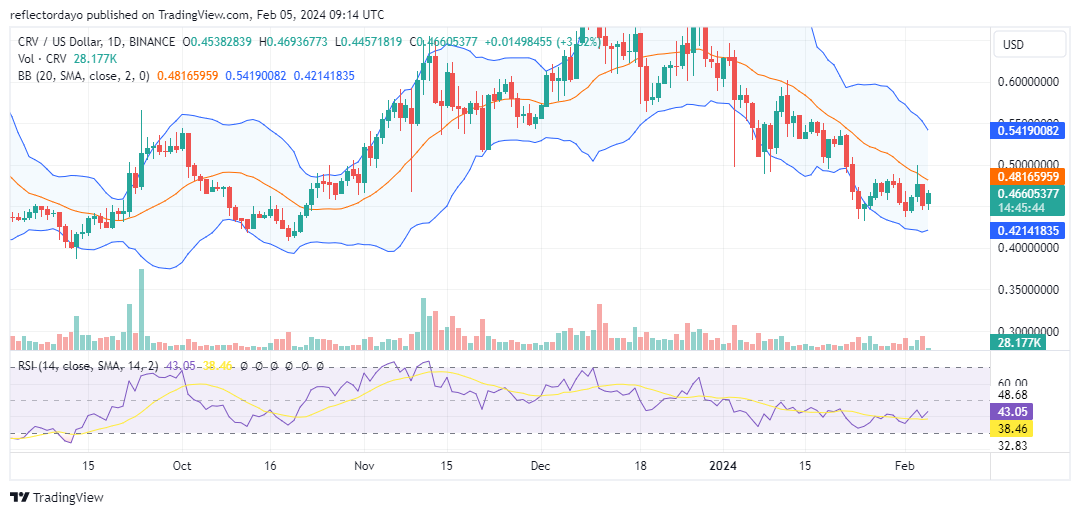
The Curve’s anticipated rebound to $0.500 faced resistance from the strong bear market, causing a dip below the threshold. Yet, at $0.450, a bullish resurgence emerged, hindering further bearish momentum. Despite an upward shift, resistance below $0.500 formed a rectangle pattern, symbolizing a tug-of-war between bulls and bears. Professional analysis recommends vigilant monitoring for potential breakout or breakdown scenarios, emphasizing the importance of thorough technical analysis at key levels for informed decision-making in this dynamic market.
Curve Market Data
- CRV/USD Price Now: $0.47
- CRV/USD Market Cap: $514 million
- CRV/USD Circulating Supply: 1.1 Billion
- CRV/USD Total Supply: 2 Billion
- CRV/USD CoinMarketCap Ranking: #106
Key Levels
- Resistance: $0.48, $0.50, and $0.55.
- Support: $0.45, $0.42, and $0.30.
The Curve Market Crypto Signal: Analyzing the Indicators
The formation of a rectangle pattern, indicative of market indecision, has occurred below the 20-day moving average. In such instances, careful attention should be directed towards critical levels in the Curve market, specifically the resistance and support within the confines of this rectangular formation. Notably, the $0.48 price level acts as resistance, while $0.45 serves as the support level.
The breach of the $0.48 resistance level would signify the strengthening of bullish forces, whereas a descent below $0.45 would signal an ascent in bearish strength. However, in the present scenario, the market exhibits an upward trajectory. It is imperative to note, though, that the volume of trade fails to substantiate the ongoing bullish candlestick depicted on the chart. The accompanying histogram for this bullish candle appears diminutive.
In instances of low trade volume, if the price fails to secure either a breakout or breakdown, the Curve market may enter a period of stagnation. This crypto signal will then be observed through the potential narrowing of the Bollinger Bands indicator around the price. Such a phase aims to establish a robust pivotal price level, laying the groundwork for the subsequent market movement. Consequently, a meticulous analysis of these elements becomes essential for informed decision-making in navigating market dynamics.
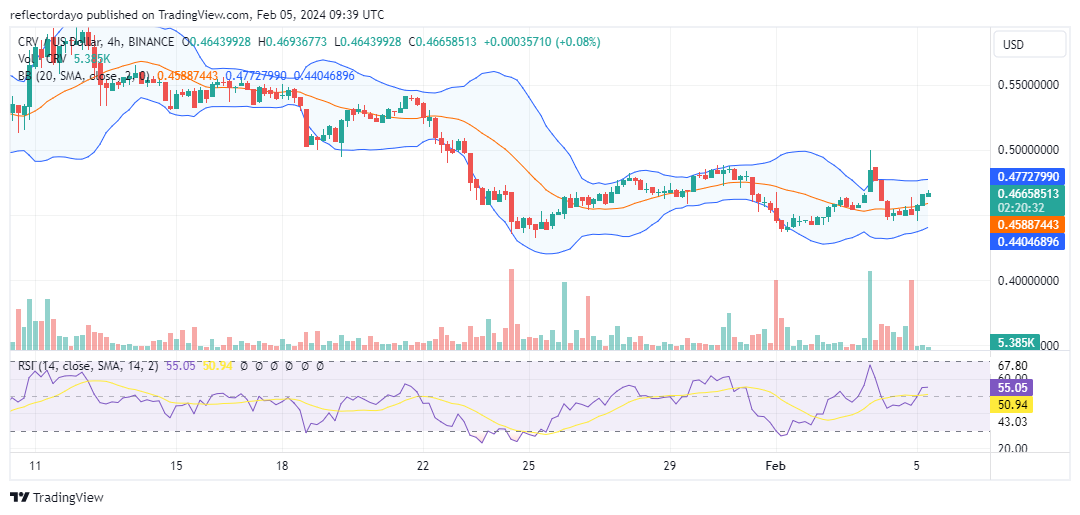
CRV/USD 4-Hour Chart Outlook
In the 4-hour chart, $0.48 is a primary resistance in the current bullish recovery, with an additional lower resistance at $0.46. Concerns arise from the recent session lacking substantial volume support, possibly due to the inconsistent bullish momentum in previous sessions. This necessitates a careful evaluation of market dynamics, highlighting the importance of vigilance and thorough analysis amid potential uncertainties.