Dogecoin (DOGE) Price Prediction: DOGE/USDT Commences Trading Above the $0.2000 Mark
Estimated Reading Time: 2 minutes
Don’t invest unless you’re prepared to lose all the money you invest. This is a high-risk investment and you are unlikely to be protected if something goes wrong. Take 2 minutes to learn more

Date: October 20, 2025
Dogecoin has begun gaining traction, and as a result, its price action has started to move upward. In fact, it has breached resistance at the $0.2000 level and is now trading above this key price point.
DOGE/USDT Long-Term Trend — Bullish (Daily Chart)
Key Price Levels:
Resistance: $0.2150, $0.2300, $0.2450
Support: $0.1900, $0.1700, $0.1500
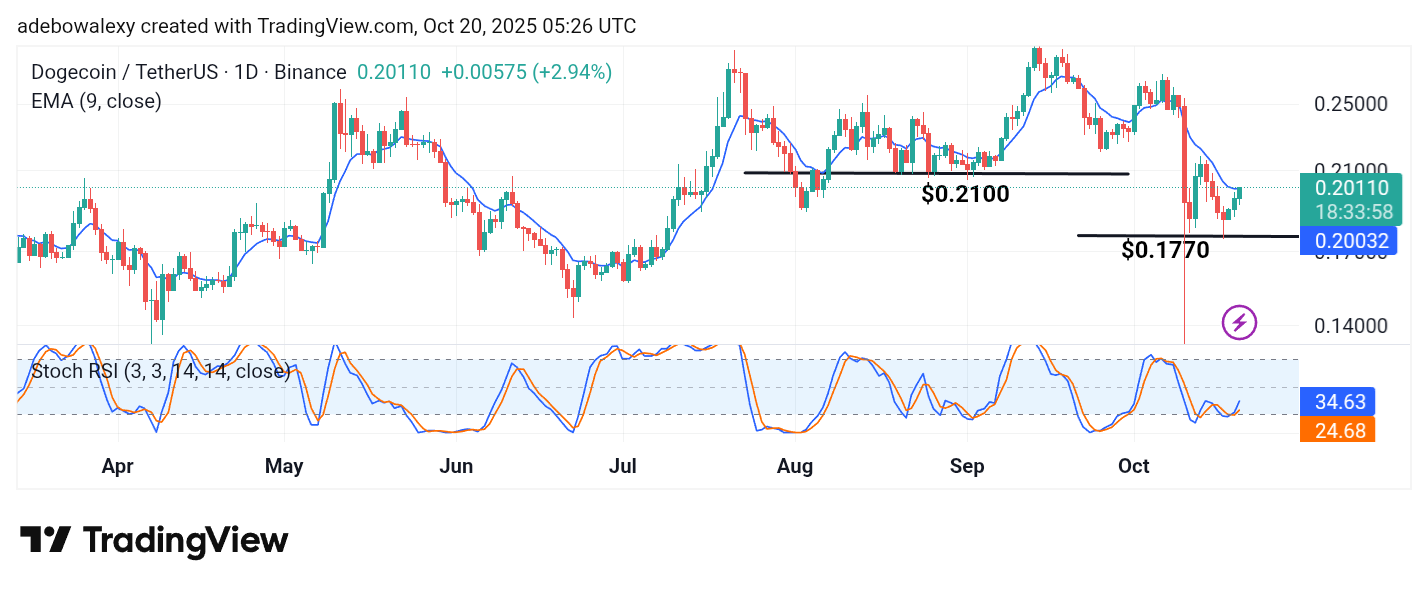
The observed upward retracement in the Dogecoin market has been ongoing for the past two sessions. In the current session, price action is pushing through the ceiling formed by the 9-day Exponential Moving Average (EMA) line. Consequently, this may lead to further upward movement in the market.
At the same time, the lines of the Stochastic Relative Strength Index (SRSI) can be seen rising from the oversold region following an upward crossover just above the 20 mark, indicating growing bullish momentum.
Dogecoin (DOGE) Price Prediction: DOGE/USDT Upward Rebound Remains Moderately Active
Price activity in the Dogecoin daily market has rebounded from the $0.1770 level. This upward bounce, which began two sessions ago, has continued and pushed the market past the 9-day EMA curve. Although the breakout occurred by a narrow margin, it carries bullish implications.
The Stochastic Relative Strength Index (SRSI) indicator lines have also completed an upward crossover in the oversold region, and the lines are now trending upward — a sign that bullish strength is gradually building.
Dogecoin (DOGE) Price Prediction: DOGE/USDT Outlook Tilts Toward a Continued Upward Retracement (4-Hour Chart)
Observing the price movement on the 4-hour chart gives the impression that bullish forces are maintaining a favorable outlook. Price action has traded above the 9-day EMA curve for the past twelve sessions and has remained on an upward trajectory.
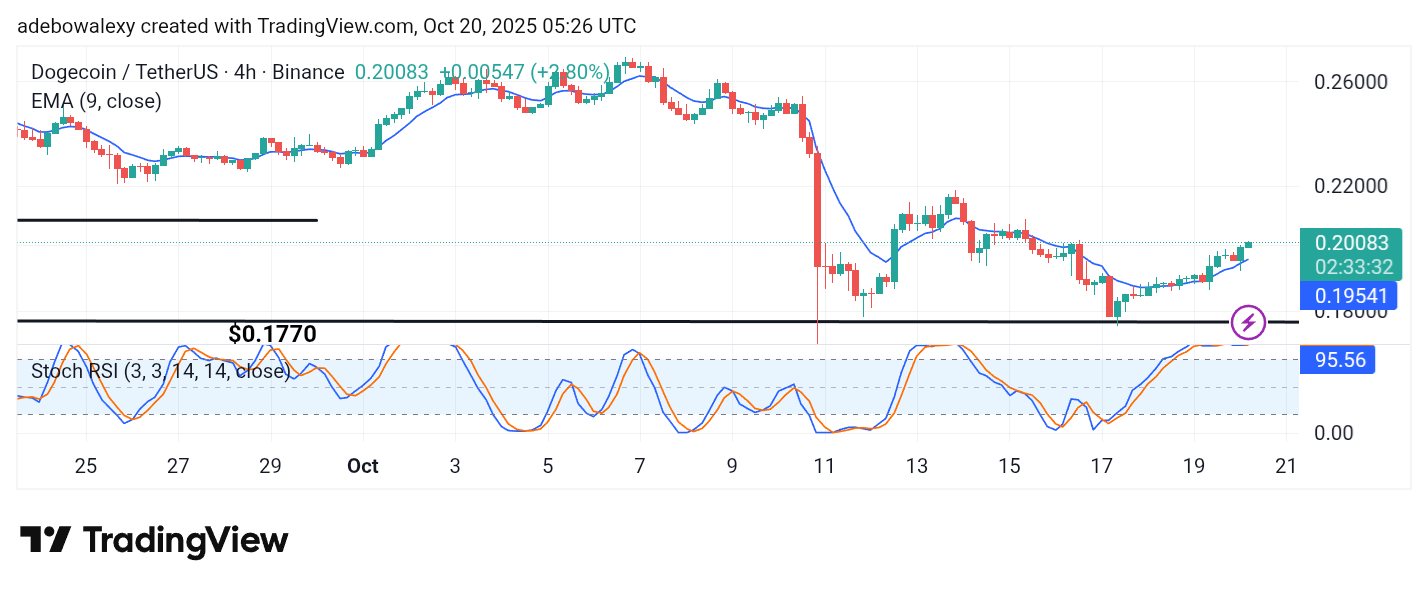
The ongoing session is represented by a green candle, while the SRSI lines remain merged and moving sideways near the 100 mark of the indicator. This suggests that the market may still have room for further upward movement, with potential short-term gains toward the $0.2200 price level.