Dogecoin (DOGE) Price Prediction: DOGE/USDT Posts Notable Recovery but Faces Rejection
Estimated Reading Time: 3 minutes
Don’t invest unless you’re prepared to lose all the money you invest. This is a high-risk investment and you are unlikely to be protected if something goes wrong. Take 2 minutes to learn more

Date: October 13, 2025
The Dogecoin (DOGE) token, similar to other major cryptocurrencies, has seen notable upward movement in its market. However, the ongoing session suggests that price forces are currently in a tussle as the market tests the $0.2100 price level. Trading activity also remains below key technical levels, so let’s examine how the market may behave next.
DOGE/USDT Long-Term Trend — Bearish (Daily Chart)
Key Price Levels:
Resistance: $0.2250, $0.2500, $0.3000
Support: $0.2000, $0.1750, $0.1500
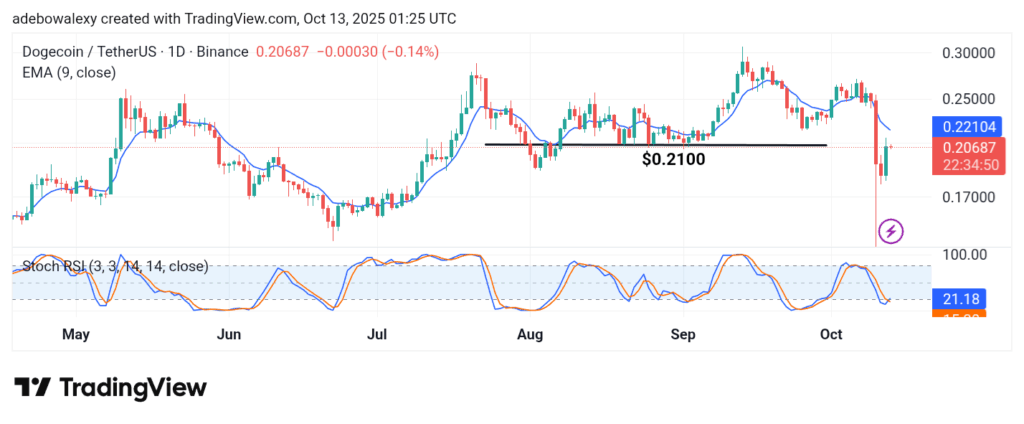
The Dogecoin market recorded a significant upward advance in the previous session. Although price action remained below the 9-day Exponential Moving Average (EMA) curve, it briefly pushed above the $0.2100 level. The ongoing session has formed a Doji candle just below the 9-day EMA line.
Despite this, the Stochastic Relative Strength Index (SRSI) indicator continues to display an upward crossover in the oversold zone, hinting that buying pressure still holds some ground.
Dogecoin (DOGE) Price Prediction: DOGE/USDT Price Forces Are Battling
Based on the current market structure, Dogecoin’s price shows bearish potential in the near term. Although the previous session appeared bullish, it was the only green candle observed over the last four trading sessions. The ongoing session has again formed a Doji candle, reflecting market indecision, right after testing the $0.2100 resistance level.
Nevertheless, the SRSI indicator lines still maintain a bullish crossover in the oversold region, suggesting that while bearish forces are present, there’s still potential for upside recovery if buyers regain control.
Dogecoin (DOGE) Price Prediction: DOGE/USDT Registers a Moderate Downward Correction (4-Hour Chart)
Extending the analysis to the 4-hour chart, price action can be seen trading slightly above the 9-day EMA curve. The last two candles on the chart are red, yet they remain positioned above the EMA line, showing that buyers still hold some short-term control.
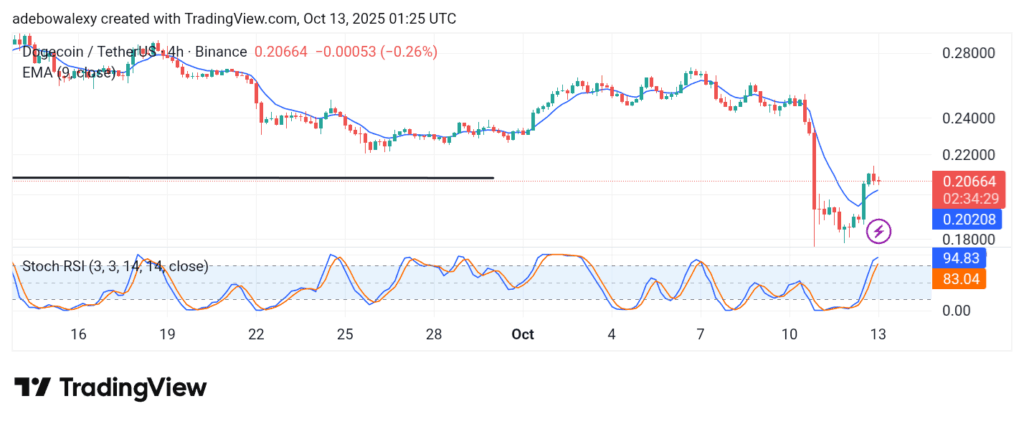
The most recent candle, however, appears to be a Doji, indicating indecision. Meanwhile, the SRSI indicator lines have risen deep into the overbought zone, signaling that downward forces are becoming increasingly likely.
As such, traders may anticipate a pullback before the market resumes an upward movement toward the $0.2250 price level.