Dogecoin (DOGE) Price Prediction: DOGE/USDT Recoils Off a Higher Base Level
Estimated Reading Time: 3 minutes
Don’t invest unless you’re prepared to lose all the money you invest. This is a high-risk investment and you are unlikely to be protected if something goes wrong. Take 2 minutes to learn more

Date: October 6, 2025
The Dogecoin market has been showing steady upward progress over time. At this point, price action can be seen rebounding again off a higher base level at the $0.2500 price area. As a result, long-term hopes for an upside continuation seem very likely.
DOGE/USDT Long-Term Trend — Bullish (Daily Chart)
Key Price Levels:
Resistance: $0.2750, $0.3000, $0.3250
Support: $0.2500, $0.2250, $0.2000
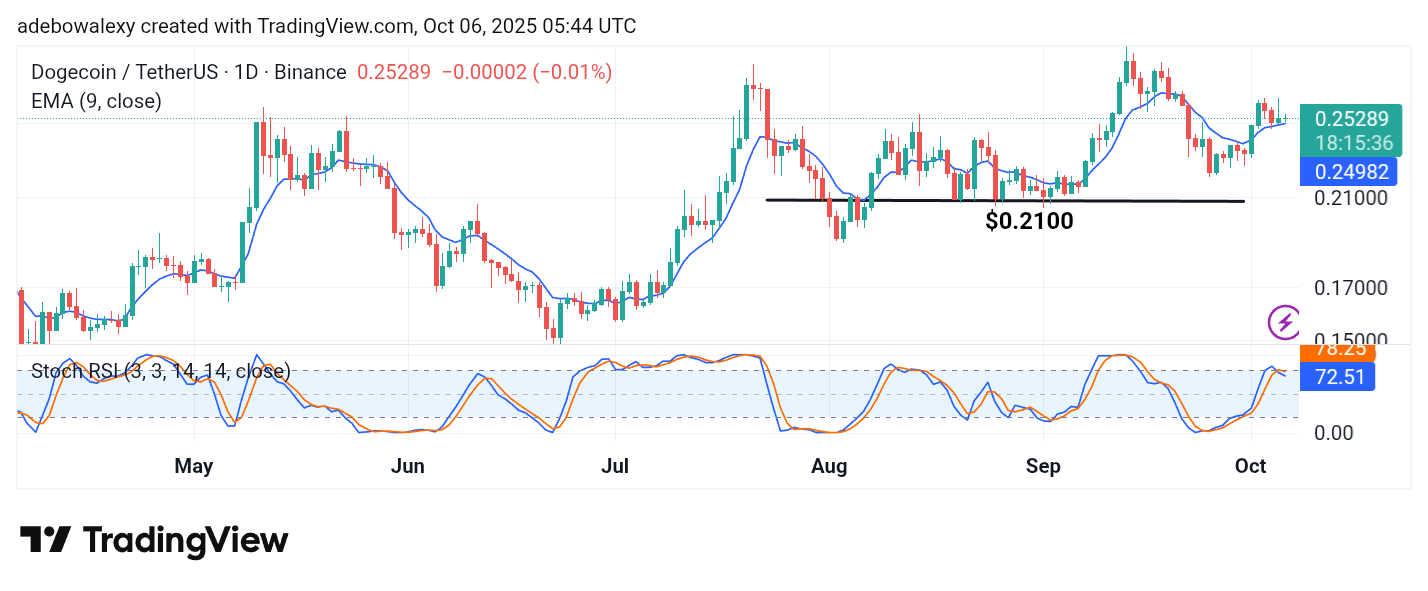
The last price candle on this Dogecoin daily chart is a green one. It appeared just as price action tested support at the 9-day Exponential Moving Average (EMA) curve. Furthermore, the Stochastic Relative Strength Index (SRSI) indicator lines remain above the 70 threshold, following a crossover in the overbought region. Likewise, the terminals of this indicator are moving sideways above the 70 mark, signaling continued bullish momentum.
Dogecoin (DOGE) Price Prediction: DOGE/USDT Market Forces Are in a Battle
Looking at the Dogecoin daily chart, one can see that bullish forces are barely maintaining their edge. The candle before the last one shows downward contraction, while the latest price candle is a Doji, suggesting indecision. The appearance of this Doji indicates a struggle between market forces, with buyers slightly in the lead.
However, recent candles have formed above the 9-day EMA line, which still supports a bullish outlook. As a result, following the crossover, the SRSI indicator lines are finding it difficult to descend, remaining sideways for now.
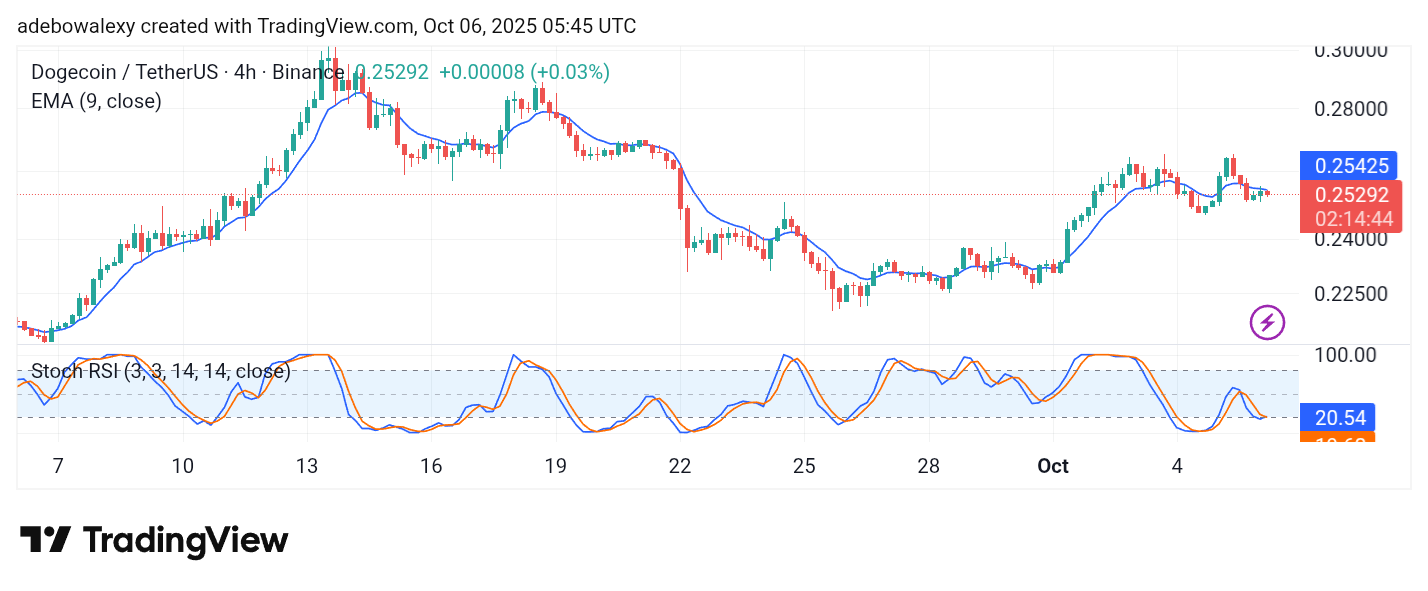
Dogecoin (DOGE) Price Prediction: DOGE/USDT Sees Rejection at the 9-Day EMA (4-Hour Chart)
On the 4-hour chart, recent Dogecoin price activity remains below the 9-day EMA curve. Lately, the market has been attempting to rise from below this technical level, but as soon as price action tested resistance at the 9-day EMA, it bounced downward in the current session.

Therefore, price action remains below this key technical landmark.
Meanwhile, the lines of the SRSI indicator are converging around the 20 mark, indicating weak momentum. Consequently, traders may wait for price action to break above the 9-day EMA before targeting the $0.2750 resistance level.