Dogecoin (DOGE) Price Prediction: DOGE/USDT Hovers Around the $0.1100 Threshold
Estimated Reading Time: 3 minutes
Don’t invest unless you’re prepared to lose all the money you invest. This is a high-risk investment and you are unlikely to be protected if something goes wrong. Take 2 minutes to learn more

Dogecoin (DOGE) Price Prediction: October 9
Trading activity in the Dogecoin (DOGE) daily market received a strong boost when Bitcoin tested resistance at $64,000. However, the trend reversed as bullish momentum dwindled, causing the market to revisit lower price levels.
DOGE/USDT Long-term Trend: Bearish (Daily Chart)
Key Price Levels:
Resistance: $0.1100, $0.1300, $0.1500
Support: $0.0900, $0.0700, $0.0500
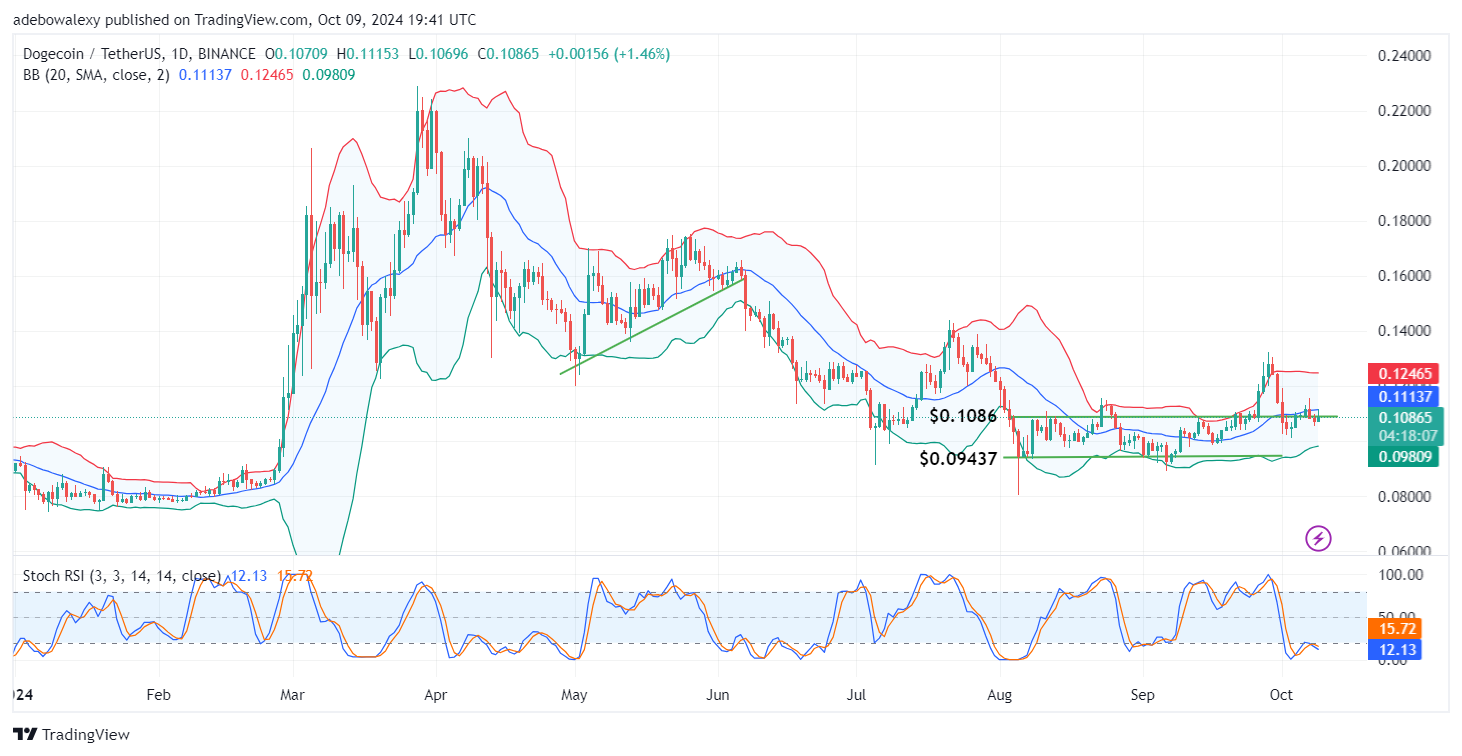
The ongoing session in the Dogecoin daily market remains solidly green. However, the appearance of a conspicuous upper shadow suggests that downward forces are quite active. Recent price activity has fallen below the middle band of the Bollinger Bands (BB) indicator but continues to hover near the resistance level at $0.1086. Simultaneously, the Stochastic Relative Strength Index (Stochastic RSI) lines have fallen deeper into the oversold region.
Dogecoin (DOGE) Price Prediction: DOGE/USDT Likely to Descend Lower
Price action in the Dogecoin daily market is trying to stay positive while remaining below the middle band of the BB indicator. Additionally, the last price candle has placed the token’s price below the $0.1086 resistance level.
Technically, this suggests that downward forces have the advantage and may push the market further into negative territory. Meanwhile, the downward trajectory of the Stochastic RSI lines also points to increasing bearish activity as the indicator lines continue to decline. This further indicates that downward pressure is likely to persist.
Dogecoin (DOGE) Price Prediction: DOGE/USDT Dips Moderately (4-Hour Chart)
The Dogecoin market on the 4-hour chart shows that price activity in the ongoing session has the potential to fall further. The last price candle can be seen dipping below the middle band of the BB indicator and the $0.1086 price level. Meanwhile, the Stochastic RSI indicator lines are still rising, with a deflection on the leading line.
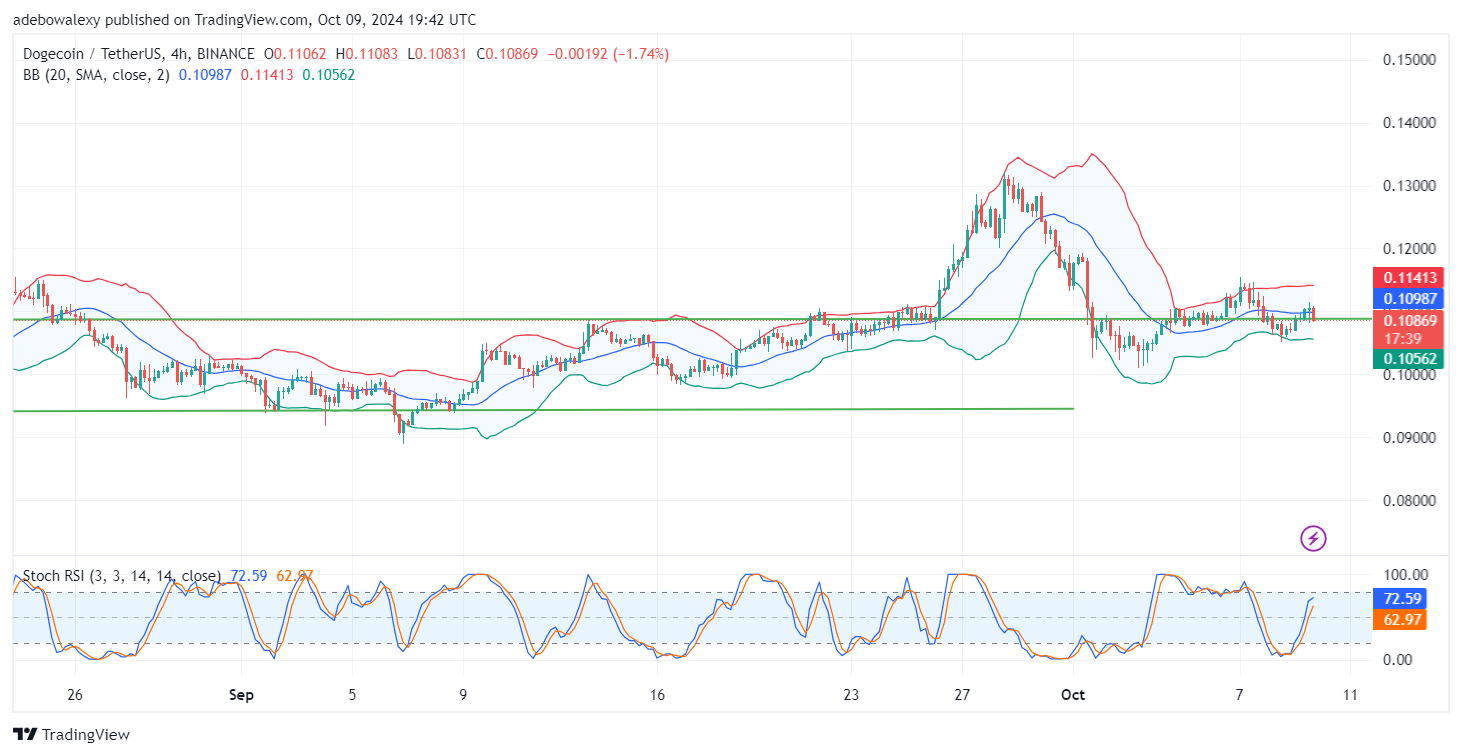
Technically, the market exhibits bearish characteristics. The fact that the last price candle has positioned the token’s price below the middle band of the BB indicator signals that downward forces are gaining prominence. Therefore, traders may aim for support at the $0.1050 and $0.1000 levels.