Dogecoin (DOGE) Price Prediction: DOGE/USDT Trades Below the $0.1200 Price Level
Estimated Reading Time: 3 minutes
Don’t invest unless you’re prepared to lose all the money you invest. This is a high-risk investment and you are unlikely to be protected if something goes wrong. Take 2 minutes to learn more

Dogecoin (DOGE) Price Prediction: June 24
Technical indicators earlier hinted that Dogecoin would likely break the support level at the $0.1300 mark. The market behaved as expected, and now the coin trades even below the $0.1200 price level. Let’s further commit to studying the price movement in this market and what may occur shortly.
DOGE/USDT Long-term Trend: Bearish (Daily Chart)
Key Price Levels:
Resistance Levels: $0.1300, $0.1500, and $0.1700
Support Levels: $0.1150, $0.1000, and $0.0850
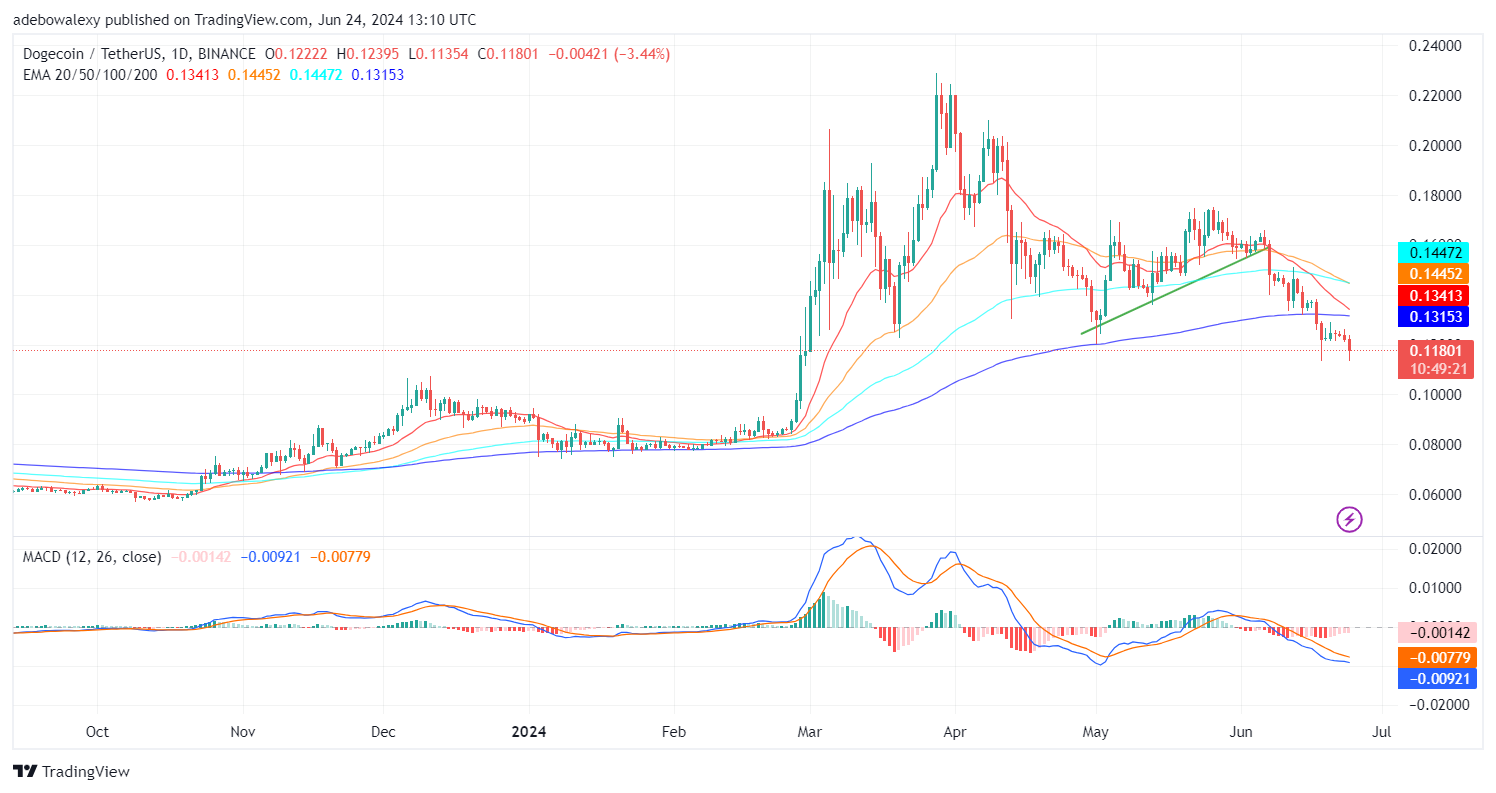
Dogecoin’s price dipped below the psychological support level at $0.1200 during today’s trading session. Meanwhile, price activity has been below all the Exponential Moving Average (EMA) curves for six trading sessions. The Moving Average Convergence Divergence (MACD) indicator lines are below the centerline. Also, the terminal part of these indicators suggests that downward forces may cause further declines. The terminal part of the indicator appears divergent, dimming hopes of a bullish crossover.
Dogecoin Price Prediction: DOGE/USDT Heads South
Indications from technical indicators are more bearish than bullish. The price candle representing the ongoing session suggests that bears are gaining more momentum, as it appears larger than that of the previous sessions. Also, the market has broken a technical support level at $0.1200. Meanwhile, Dogecoin trades below all the EMA lines and the indicator lines are already crossing over above price action.
The base of the MACD is pale red, which suggests a decline in bearish momentum. However, the indication of a continued downward correction, as indicated by the EMA lines, is quite strong. Combining this with the fact that the terminal part of the MACD seems divergent, it seems quite possible that the market will descend towards the $0.1100 mark.
DOGE/USDT Medium-term Trend: Dogecoin Remains Under Pressure (4H Chart)
While the last price candle on the Dogecoin 4-hour market has presented a minute rebound, it can be seen that price action lies heavily under the EMA lines. The last price candle landed green, while the lines of the MACD continued downward below the equilibrium level. The bars of the MACD are solid red, pointing out that downward forces are still mounting pressure on the market.
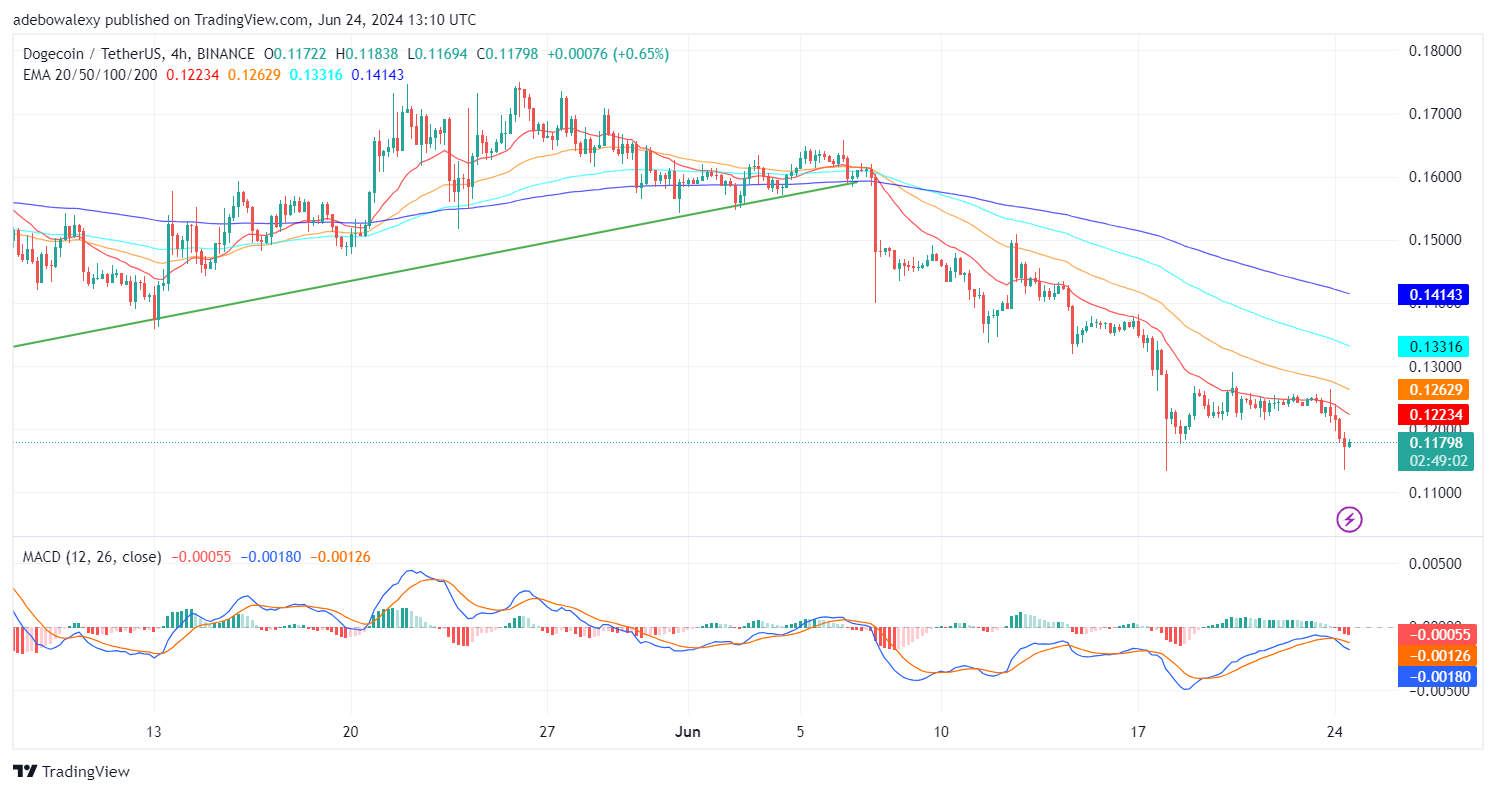
The fact that price activity is below the EMA lines aligns with bearish anticipations on the daily chart. Consequently, these forces seem to overwhelm any bullish rebound. The color of the MACD bars suggests that downward forces are still formidable in causing further downward corrections. Therefore, the market seems oriented towards hitting the $0.1100 support level in subsequent sessions.