Dogecoin (DOGE) Price Prediction: DOGE/USDT Witnesses Heavy Pull
Estimated Reading Time: 2 minutes
Don’t invest unless you’re prepared to lose all the money you invest. This is a high-risk investment and you are unlikely to be protected if something goes wrong. Take 2 minutes to learn more

Date: September 1, 2025
The Dogecoin market has been dwelling below key technical levels. As such, the token isn’t able to gather notable buying interest. Price action in this market seems to be succumbing to bearish pulls. As it stands, price action in this market requires a significant amount of push to break free.
DOGE/USDT Long-Term Trend—Bearish (Daily Chart)
Key Price Levels:
Resistance: $0.2250, $0.2500, $0.2750
Support: $0.2000, $0.1750, $0.1500
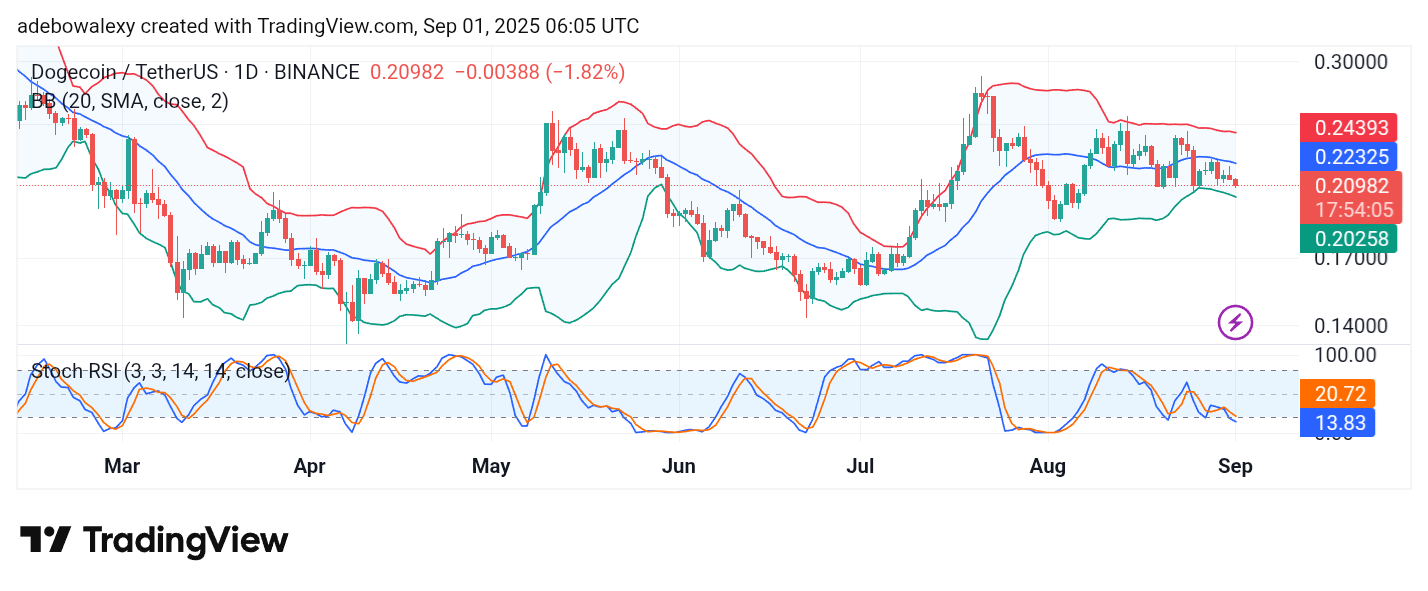
Price action in the Dogecoin market recently bounced off the resistance created by the middle limit of the Bollinger Bands BB indicator. The ongoing session has extended the trend as the corresponding price candle has appeared red. Likewise, the Stochastic Relative Strength Index curves are still falling deep into the oversold region, without any reversal move in sight.
Dogecoin (DOGE) Price Prediction: DOGE/USDT Market Set to Slide Lower
In the Dogecoin daily chart, price action has edged lower below key technical levels. As such, this market seems ready to see more bearish progress in the coming sessions.
The last price candle can be seen edging lower, breaching the previous almost sideways trajectory. Similarly, the lines of the SRSI indicator continue to hint that bearish forces are leading. The lead line of the indicator has fallen below the 20 threshold. As it is, this hints at bearish dominance and as such the market may slide lower.
Dogecoin (DOGE) Price Prediction: DOGE/USDT Bears Retain a Solid Stand (4-Hour Chart)
In the Dogecoin 4-hour chart, it is visible that downward forces are keeping a strong grip on the marke. Here, ever since price action turned around the middle limit of the BB indicator, the appearing price candles have been bearish.
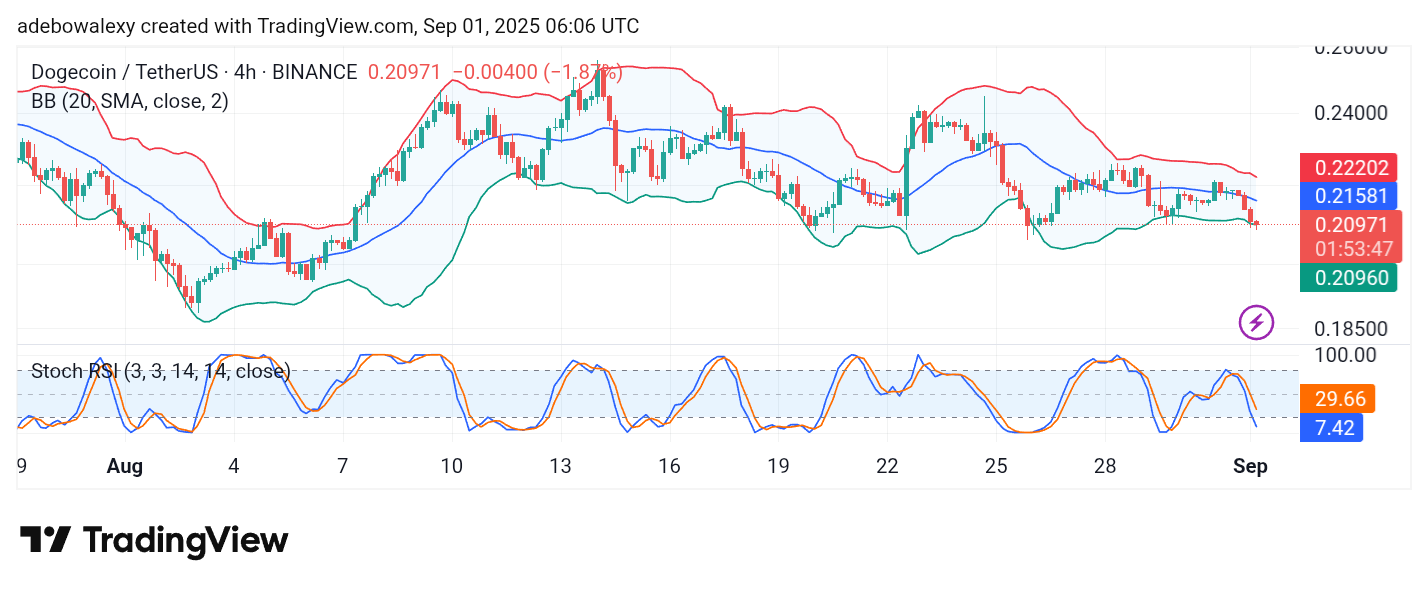
At this point, the ongoing session pushes against the lowest limit of the BB indicator. Similarly, the lines of the SRSI indicator have been experiencing a free and steep fall into the oversold region. Technically, this suggests price action may soon hit the $0.2000 price level.