Ethereum (ETH/USDT) Suspends Between Critical Levels
Estimated Reading Time: 3 minutes
Don’t invest unless you’re prepared to lose all the money you invest. This is a high-risk investment and you are unlikely to be protected if something goes wrong. Take 2 minutes to learn more
Ethereum Long-term Analysis: Ranging
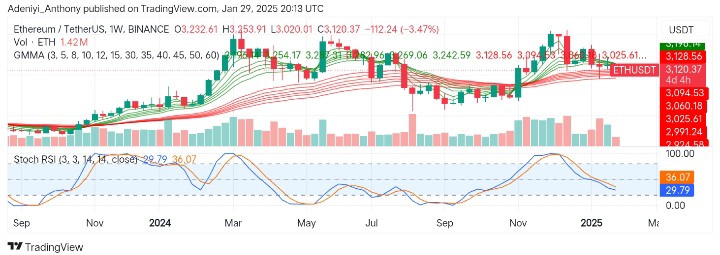
Ethereum against the Tether on a weekly basis towards the end of last year has seen a significant rally to the North in the previous session. However, the seems to be experiencing a pullback as the price drops 3.47% below the previous session.
Recent price actions suggested by the Guppy Multiple Moving Averages (GMMAs) and the Stochastic RSI show the tendency for a possible correction phase, though the medium-to-long-term bullish trend remains intact.
To this end, the market remains cautiously bullish, with ETH/USDT holding above key support levels.
Currently, Ethereum is trading at $3,120.37 with 1.42 million traded volumes for the week.
Technical Indicators
Major Resistance Levels: $3,253.91, $3,287.31, and $3,400
Major Support Levels: $3,094.53, $3,025.61, and $2,991.24
Ethereum Technical Analysis
The analysis of Ethereum against the Tether on a weekly timeframe shows that the pair is currently ranging within a tight range as seen in the positioning of the price between the short-term and long-term EMAs.
Moreover, the Stochastic RSI suggests the pair is approaching the oversold region, as the lines trend below the 20-mark level. Though this signals a continued downtrend, it is a buying opportunity if buying momentum increases soon.
However, the overall sentiment remains slightly bullish, but breaking below $3,025.61 would trigger a deeper correction.
ETH/USDT Analysis: A Renewed Hope on the Horizon
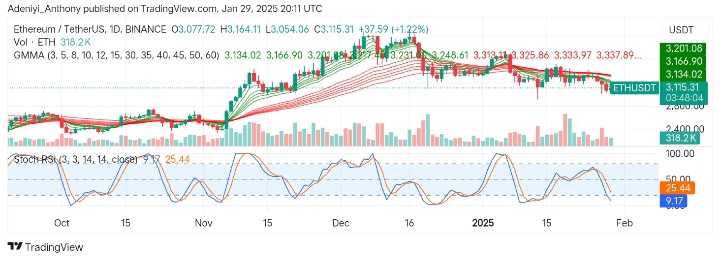
On the daily timeframe, ETH/USDT is currently trending downward, with the price operating below the GMMAs. This suggests the bears are still in control of the market; however, the current uptick of 1.22% in price reflects a positive rebound for the day.
Also, the oscillator at the bottom of the chart indicates the pair is oversold and may be due for a short-term bounce if buying pressure increases.
However, as ETH/USDT awaits confirmation, a break above $3,134 with increased bullish volume would push the price toward $3,201 in the near term; otherwise, a break below the current level would dip the price toward $3,000.
You can purchase crypto coins here. Buy LBlock