Ethereum Oscillates as It Encounters Resistance Near $3,600
Estimated Reading Time: 2 minutes
Don’t invest unless you’re prepared to lose all the money you invest. This is a high-risk investment and you are unlikely to be protected if something goes wrong. Take 2 minutes to learn more

Ethereum Price Long-Term Analysis: Bearish
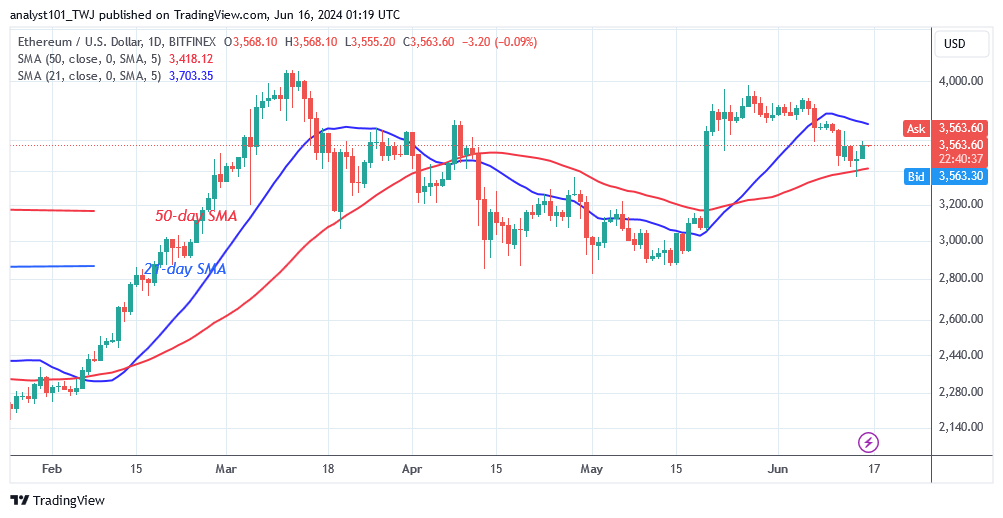
Ethereum’s (ETH) price is trading between the moving average lines as it encounters resistance near $3,600. The altcoin recovers support and resumes its upward trend, but the upward correction is met with resistance at $3,600. Ether is currently trading between a limited range of $3,600 and the 50-day SMA. For the past 48 hours, the altcoin has been trading above the $3,500 mark.
On the upside, a price rebound will propel the altcoin above the $3,600 barrier level and the 21-day SMA. The bullish momentum will lead to a high of $3,800. If the altcoin retraces and falls below the 50-day SMA, Ether may drop to a low of $3,000. Meanwhile, ETH/USD is currently valued at $3,561.
Technical indicators:
Major Resistance Levels – $3, 600, $3,800, $4,000
Major Support Levels – $2.600, $2, 400, $2,200
Ethereum Indicator Analysis
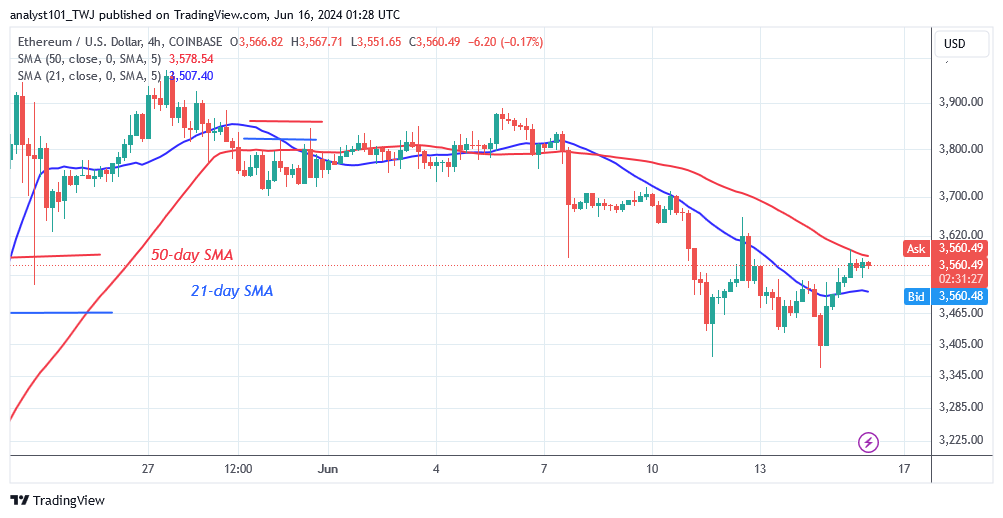
Ether is oscillating between the moving average lines, but the price bars are meeting resistance at $3,600. The cryptocurrency price is caught in the center of the moving average lines. The implication is that Ether will trend once the moving average lines are broken. The 4-hour chart shows Ether bouncing below the 50-day SMA resistance line.
Conclusion
Since the price drop on June 11, Ethereum has been trading between $3,400 and $3,620 as it encounters resistance near $3,600. Buyers have been rebuffed twice as they attempted to keep the price above the 50-day SMA and the $3,620 resistance level. Ether is currently trading below the barrier level in anticipation of a bullish trend. The cryptocurrency’s signal is positive, but it is locked within a range.
You can purchase Lucky Block here. Buy LBLOCK
Note: Cryptosignals.org is not a financial advisor. Do your research before investing your funds in any financial asset or presented product or event. We are not responsible for your investing results