Hyperliquid (HYPE) Sustains Above the $70 Threshold
Estimated Reading Time: 3 minutes
Don’t invest unless you’re prepared to lose all the money you invest. This is a high-risk investment and you are unlikely to be protected if something goes wrong. Take 2 minutes to learn more

- HYPE maintains support above $70, with fundamentals suggesting growing market strength.
- The SRSI shows early bullish signals despite price remaining below the 9-day EMA.
- A sustained upward move could push HYPE towards the $100 resistance level.
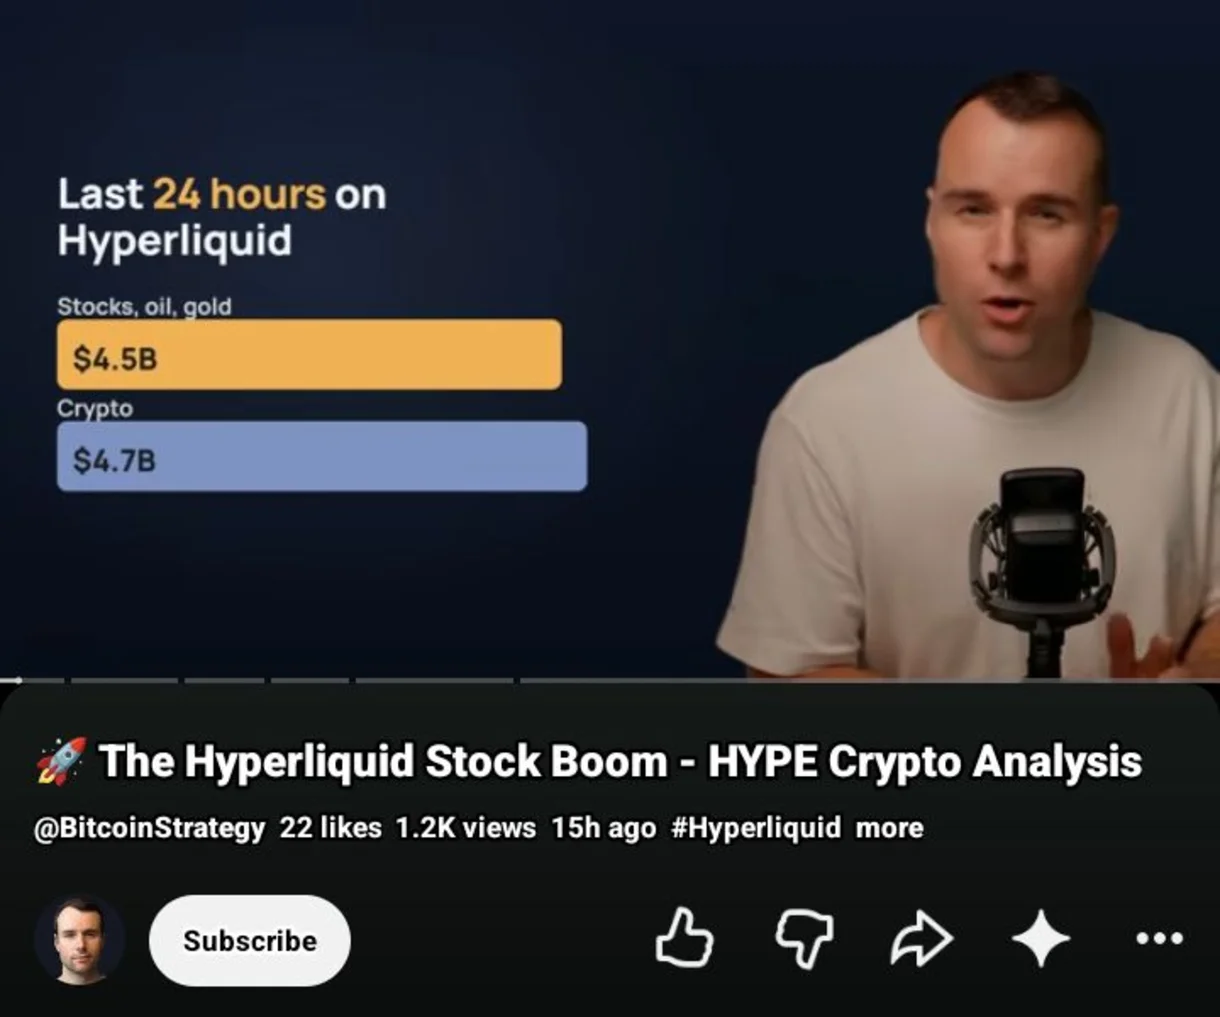
Analysts believe that the Hyperliquid token may be setting up for a significant price move. Fundamentals suggest the project’s ecosystem is growing impressively, with a substantial $4.5 billion capitalization across the stocks, oil, and gold markets. Technically, price action appears to have found a solid support base for a potential bullish move.
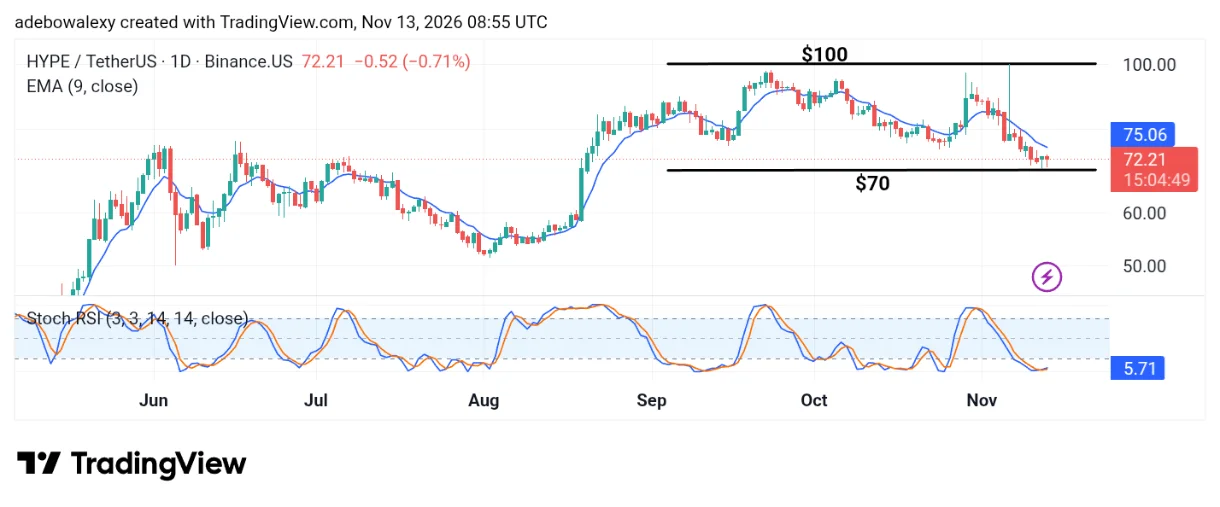
HYPE/USDT 24-Hour Chart
On the Hyperliquid daily chart, we can see that price action in the current session has tested the $70 baseline. Consequently, the last three price candles on the chart appear to be contracting upward from the $70 threshold.
However, price movement remains below the 9-day Exponential Moving Average (EMA). The Stochastic Relative Strength Index (SRSI) lines are still in the oversold region, with their terminal points beginning to diverge and move upward.
Hyperliquid May Have Started Taking Off
Although bullish signals remain somewhat weak, the available fundamentals may provide the support needed to strengthen the developing upward movement. The latest price candle on the daily chart is red but shows an upward contraction.
Meanwhile, the SRSI indicates an oversold condition, with its lines positioned near the bottom of the oversold region. Nevertheless, the terminal points of the indicator lines are beginning to diverge as they turn upward. This further supports the possibility that prices could continue rising in the near term.
HYPE Traders May Want to Join the Move Early
Both fundamental and technical indicators suggest that bullish momentum may be building around this project. The current session is showing an upward contraction, while the SRSI indicator lines have produced an upward crossover after reaching their lowest levels in the oversold region. Technically, these developments suggest the possibility of further price growth towards the resistance level at $100.