Hyperliquid Has a Good Technical Outlook
Estimated Reading Time: 3 minutes
Don’t invest unless you’re prepared to lose all the money you invest. This is a high-risk investment and you are unlikely to be protected if something goes wrong. Take 2 minutes to learn more
- Hyperliquid uses a “burn-and-earn” model, with trading fees supporting $HYPE buybacks and burns while staking adds utility.
- HYPE is showing signs of a potential bullish reversal after dipping below the 9-day EMA, with SRSI moving upward from oversold levels.
- The token could regain the $100 level and potentially target $150 if bullish momentum strengthens.
Rather than relying on hype or inflation, the platform uses a “burn-and-earn” model that strengthens $HYPE through activity. Trading fees fund token buybacks and burns, while staking adds utility through network security and trading-fee benefits. This seems to be keeping the market on a good technical footing.
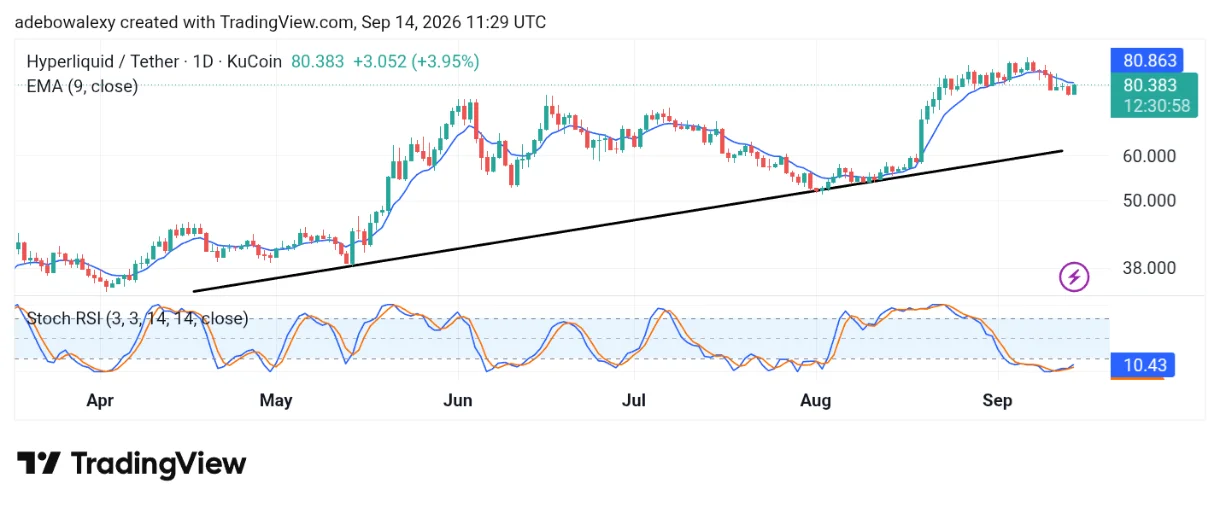
HYPEUSDT on a 24-Hour Market Chart
Looking at the token’s daily chart, the ongoing session is represented by a green price candle. Also, it is located just below the 9-day Exponential Moving Average (EMA) line.
At the same time, the lines of the applied Stochastic Relative Strength Index (SRSI) are not taking an upward path from the oversold region of the indicator. As such, should price action cross above the 9-day EMA, the trend may resume on a long upward path from here.
Hyperliquid Is Setting a New Upward Course
The HYPEUSDT market recently dipped below the 9-day EMA curve. As such, this would have signaled a strong bearish correction. However, the ongoing session has introduced the indication that upside forces are trying to push the market upwards.
At the same time, the lines of the Stochastic Relative Strength Index are in the oversold region and are already taking an upward bearing. As it is, indications align that upside forces have a huge opportunity of taking the market to significantly higher ground.

The Hyperliquid Market Eyeing a New High
It could be seen that the resistance at the $100 price level has already been broken in this market. However, a pullback brought prices below the 9-day EMA and into the $80 region.
As a result, the SRSI lines are already in the oversold region but have taken an upward turn. Therefore, a significant upward correction in this market will bring trading back above the $100 mark and higher, perhaps towards the $150 price level.