Litecoin (LTC) Price Prediction: LTC/USDT Eyes the $90.00 Mark
Estimated Reading Time: 3 minutes
Don’t invest unless you’re prepared to lose all the money you invest. This is a high-risk investment and you are unlikely to be protected if something goes wrong. Take 2 minutes to learn more

Litecoin Price Prediction Date: May 5, 2025
The Litecoin market has been steadily approaching a psychological price level as it crosses the $85.00 mark. Let’s examine the market by analyzing the signals emanating from the price chart below in more detail.
LTC/USDT Long-Term Trend: Bullish (Daily Chart)
Key Price Levels:
Resistance: $90.00, $100.00, $110.00
Support: $80.00, $70.00, $60.00
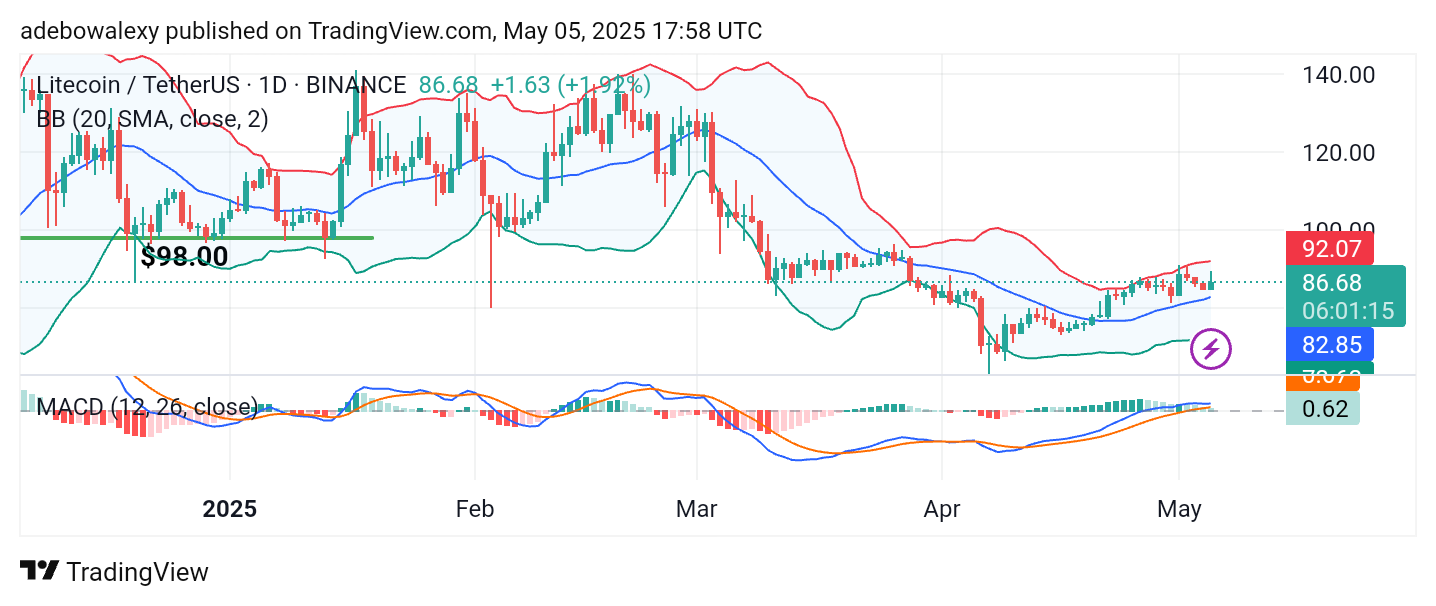
The ongoing sessions in the Litecoin market remain bullish. This is evident as the corresponding price candle appears green and is positioned above the middle band of the Bollinger Bands (BB) indicator. The market has maintained an upward trajectory since rebounding near the $75 mark. Furthermore, the Moving Average Convergence Divergence (MACD) lines are above the equilibrium level, though they appear to be trending sideways. Meanwhile, the histogram bars of the MACD are pale green and continue to appear above the equilibrium level.
Litecoin (LTC) Price Prediction: LTC/USDT Holds Above a Crucial Baseline
The Litecoin market continues on an upward path, judging by the recent price trajectory. The last green price candle has appeared above the middle band of the indicator, suggesting the market is moving toward psychological resistance at the $90.00 level.
Supporting this bullish trend is the general direction of the MACD lines, which have continued upward and surpassed the equilibrium level. While upward momentum shows signs of hesitation, it remains intact as the MACD histogram bars still appear above the baseline.
Litecoin (LTC) Price Prediction: LTC/USDT Buyers Are Active
Market participants in the Litecoin market appear optimistic, especially as the price action is quickly recovering from recent setbacks. The previous session on the 4-hour chart showed a notable downward retracement.
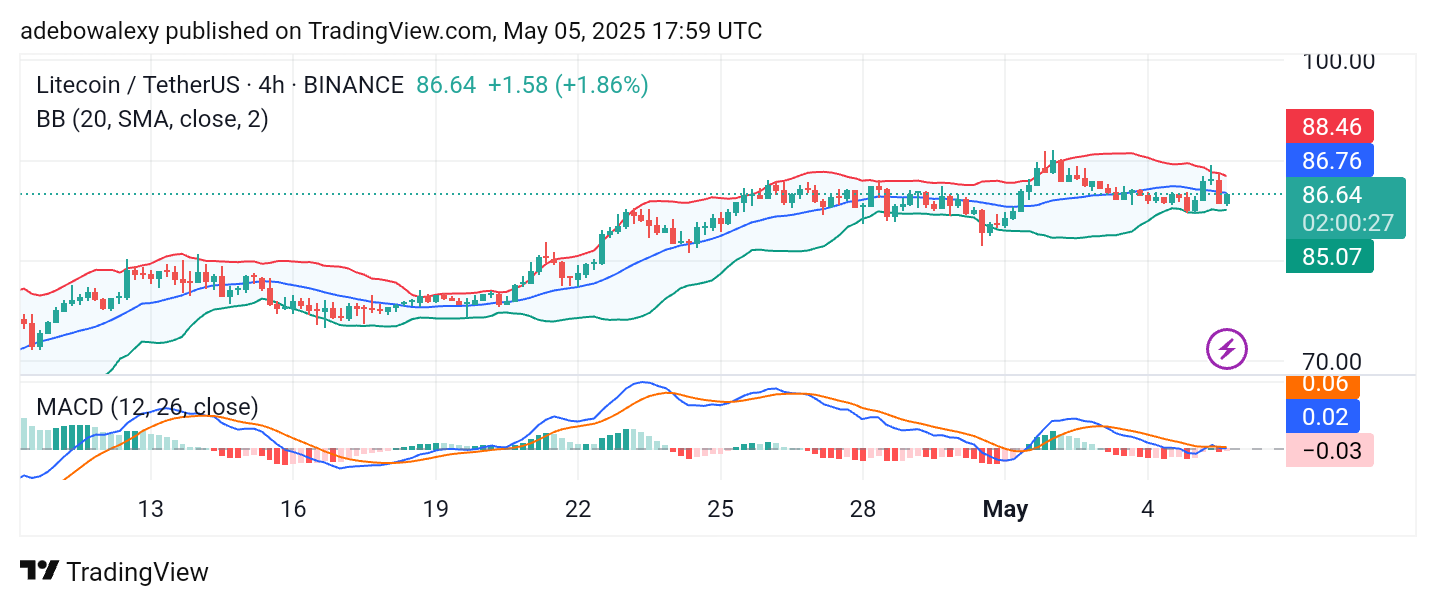
.In response, the current session has produced a rebound, pushing the market back toward the middle band of the Bollinger Bands. Meanwhile, the MACD lines are fluctuating around the equilibrium level, suggesting a potential convergence for a bullish crossover. Consequently, traders can still anticipate a possible revisit to the $90.00 price level.