Litecoin (LTC/USD) Market Valuation Hovers at $150
Estimated Reading Time: 3 minutes
Don’t invest unless you’re prepared to lose all the money you invest. This is a high-risk investment and you are unlikely to be protected if something goes wrong. Take 2 minutes to learn more
Litecoin Price Prediction – December 28
The LTC/USD market valuation hovers at $150 around the upper bearish channel, showing the correction that the market keeps over time. The crypto falls from $157 to $145 before rising, trading around $152 at a negative percentage amount of about 1.98 as of writing.
LTC/USD Market
Key Levels:
Resistance levels: $175, $200, $225
Support levels: $135, $115, $95
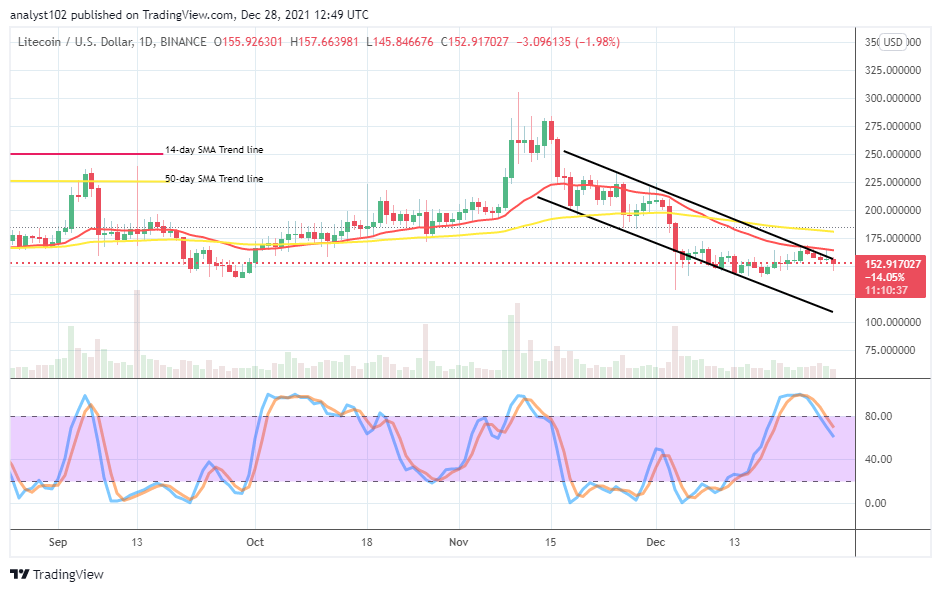
LTC/USD – Daily Chart
It is revealed on the LTC/USD daily chart that the crypto-economic market valuation hovers at the $150 trading level. The upper bearish channel trend line, yet, instrumental in the current trading situation as it is drawn slightly downward across the smaller SMA to depict the path that price maintains. The 50-day SMA indicator is above the 14-day SMA indicator. The Stochastic Oscillators are more slantingly cross the lines southbound from the overbought region against the range of 80. That signifies that downward pressure is ongoing.
Will the LTC/USD price fall further under the trend lines of the SMAs as the market valuation hovers at $150?
It still somewhat appears that the LTC/USD prices trade under a depression moment as the crypto market valuation hovers at $150. The market may still have to experience a selling force until support is found underneath the value line to start making another cycle of upswings. In a bid to achieve those trading presumptions, resistances around $175 have to breach northward.
On the downside of the technical analysis, the LTC/USD market bears still appear to have the chance to push price southward against the lower trading zone located before $125 that the market has been trying to build up support. The downward force may not be forthcoming on a higher note. And, if the present trading situation is prolonged, there will be s sideways trend invading the crypto-economic activities.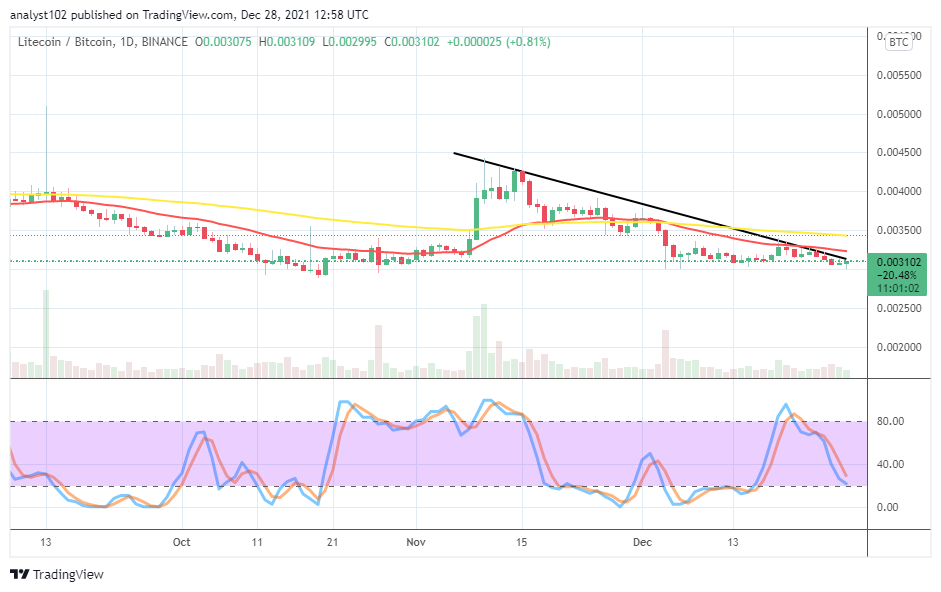
LTC/BTC Price Analysis
In comparison, Litecoin is still relatively found debasing as placed with the trending capacity of Bitcoin on the price daily analysis chart. The cryptocurrency pair market hovers underneath trend lines of the SMAs. The 50-day SMA indicator is above the 14-day SMA indicator. The Stochastic Oscillators have moved southbound closer to the range of 20 to indicate that the counter crypto’s forces are prevailing over the base crypto until now. The sudden emergence of a bullish candlestick against the 14-day SMA will potentially set LTC on a recovery journey whenever that occurs afterward.
Note: Cryptosignals.org is not a financial advisor. Do your research before investing your funds in any financial asset or presented product or event. We are not responsible for your investing results.
You can purchase crypto coins here. Buy Tokens