Osmosis (OSMO/USD) Absorbs Bearish Pressure at $0.050
Estimated Reading Time: 3 minutes
Don’t invest unless you’re prepared to lose all the money you invest. This is a high-risk investment and you are unlikely to be protected if something goes wrong. Take 2 minutes to learn more

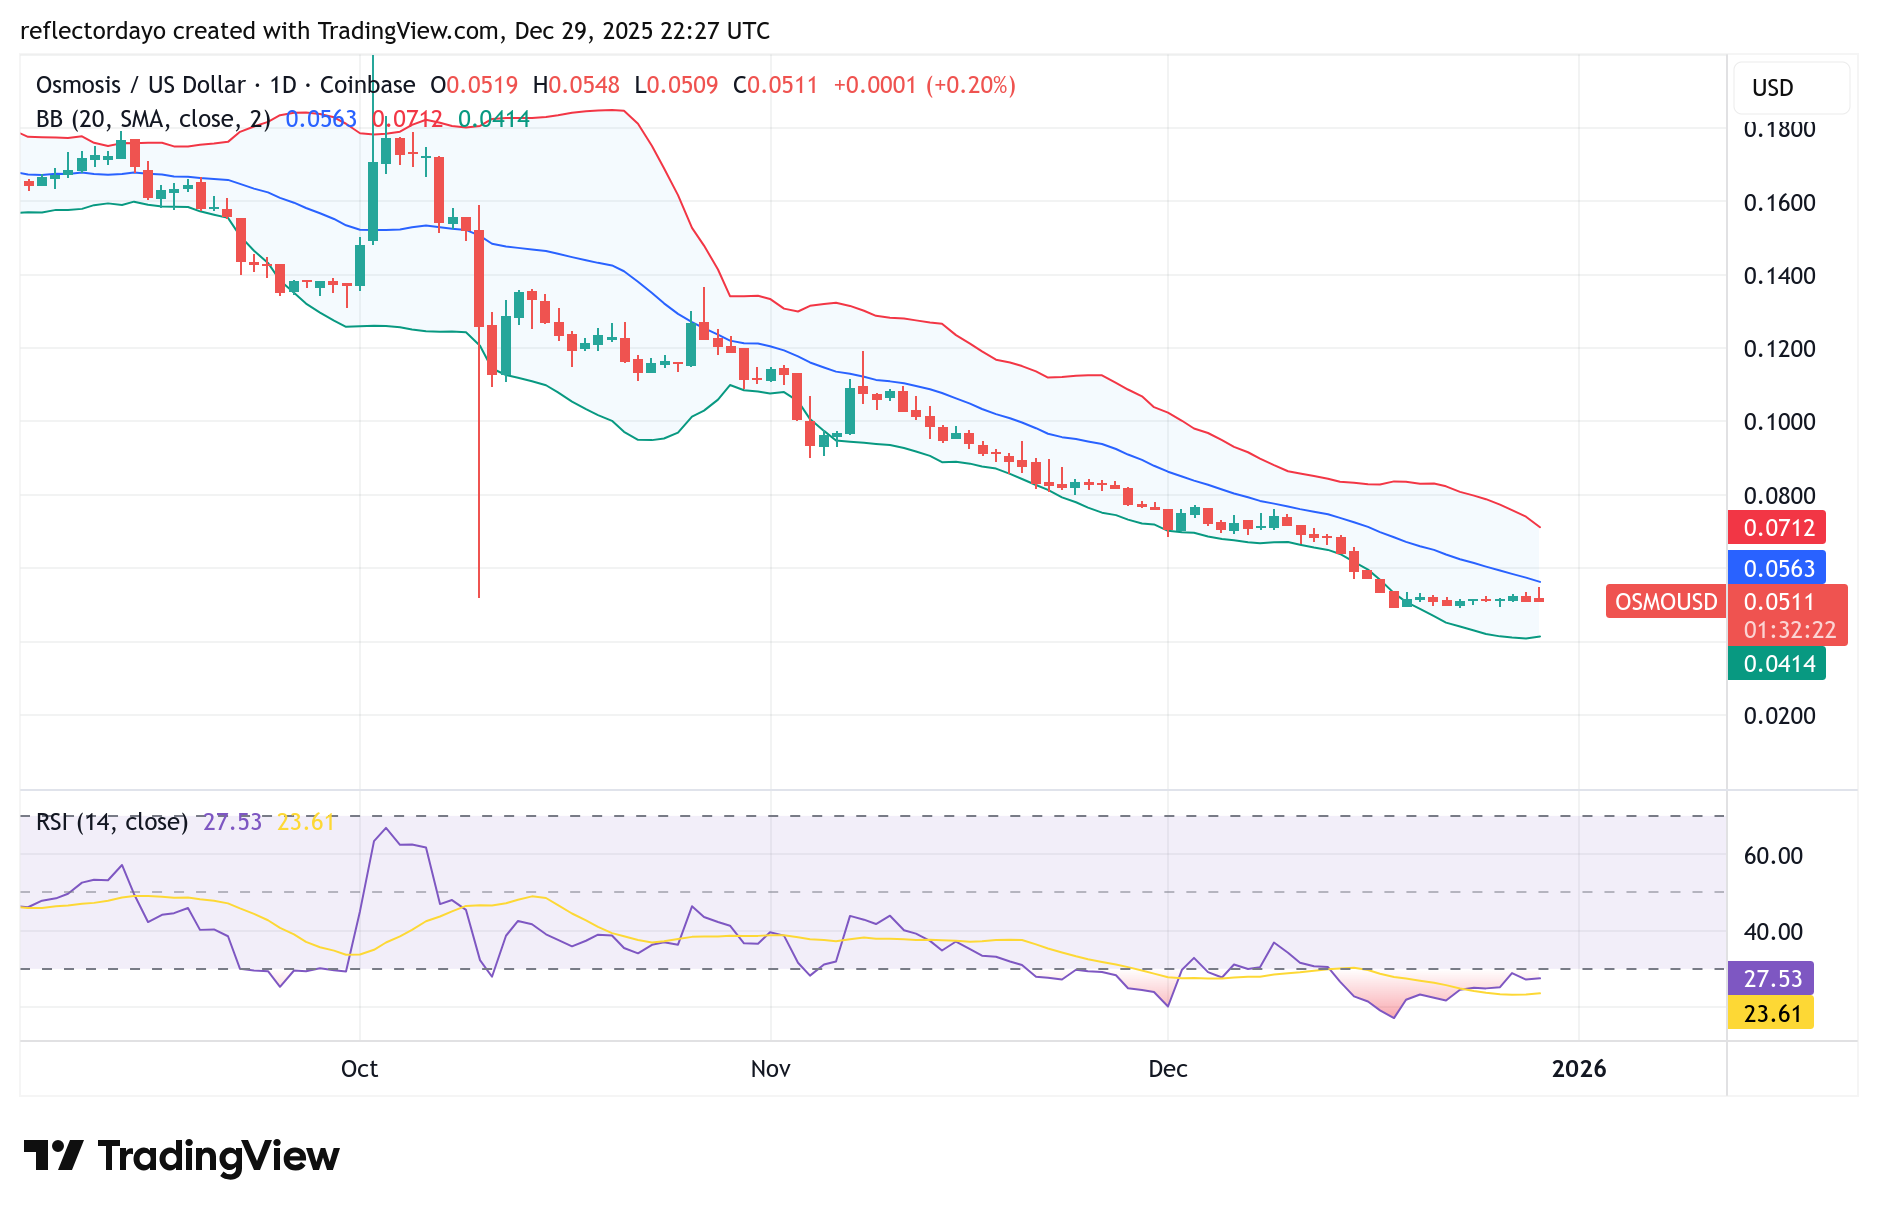
The Osmosis market has been in a sustained downtrend for some time, beginning in early October after peaking near the $0.20 price level. By October 10, the market identified the $0.050 level as a potential support zone, following an initial test of this area.
Since then, price action continued its gradual descent toward this support. When the market reached the $0.050 level on December 17, bullish interest began to emerge, effectively absorbing bearish pressure. This shift in sentiment has kept the price consolidating around the $0.050 level, suggesting that buyers are actively defending this zone.
Osmosis (OSMO/USD) Market Data
- OSMO/USD Price Now: $1.238
- OSMO/USD Market Capitalization: $462 million
- OSMO/USD Circulating Supply: 375 million MORPHO
- OSMO/USD Total Supply: 999.99 million MORPHO
- OSMO/USD CoinMarketCap Ranking: #93
Key Levels to Monitor
- Resistance: $0.06, $0.07, $0.08
- Support: $0.04, $0.03, $0.02
Osmosis Market Analysis: Technical Viewpoint
Bullish resilience became evident after bearish price action reached this zone on December 17. The Osmosis market’s reaction at this level highlights growing buyer strength and suggests that accumulation may already be underway.
Given the historical significance of this price area in the crypto signal, it is natural to expect a bullish bias from traders around this level. The ongoing consolidation further supports the idea that market participants may be positioning ahead of a potential move. As a result, attention remains firmly on this zone, with expectations building for a possible breakout.
From an indicator perspective, the Relative Strength Index (RSI) shows the market hovering in oversold territory. When a key technical support level aligns with an oversold RSI reading, it often signals the potential for a strong price move—specifically, a rebound.
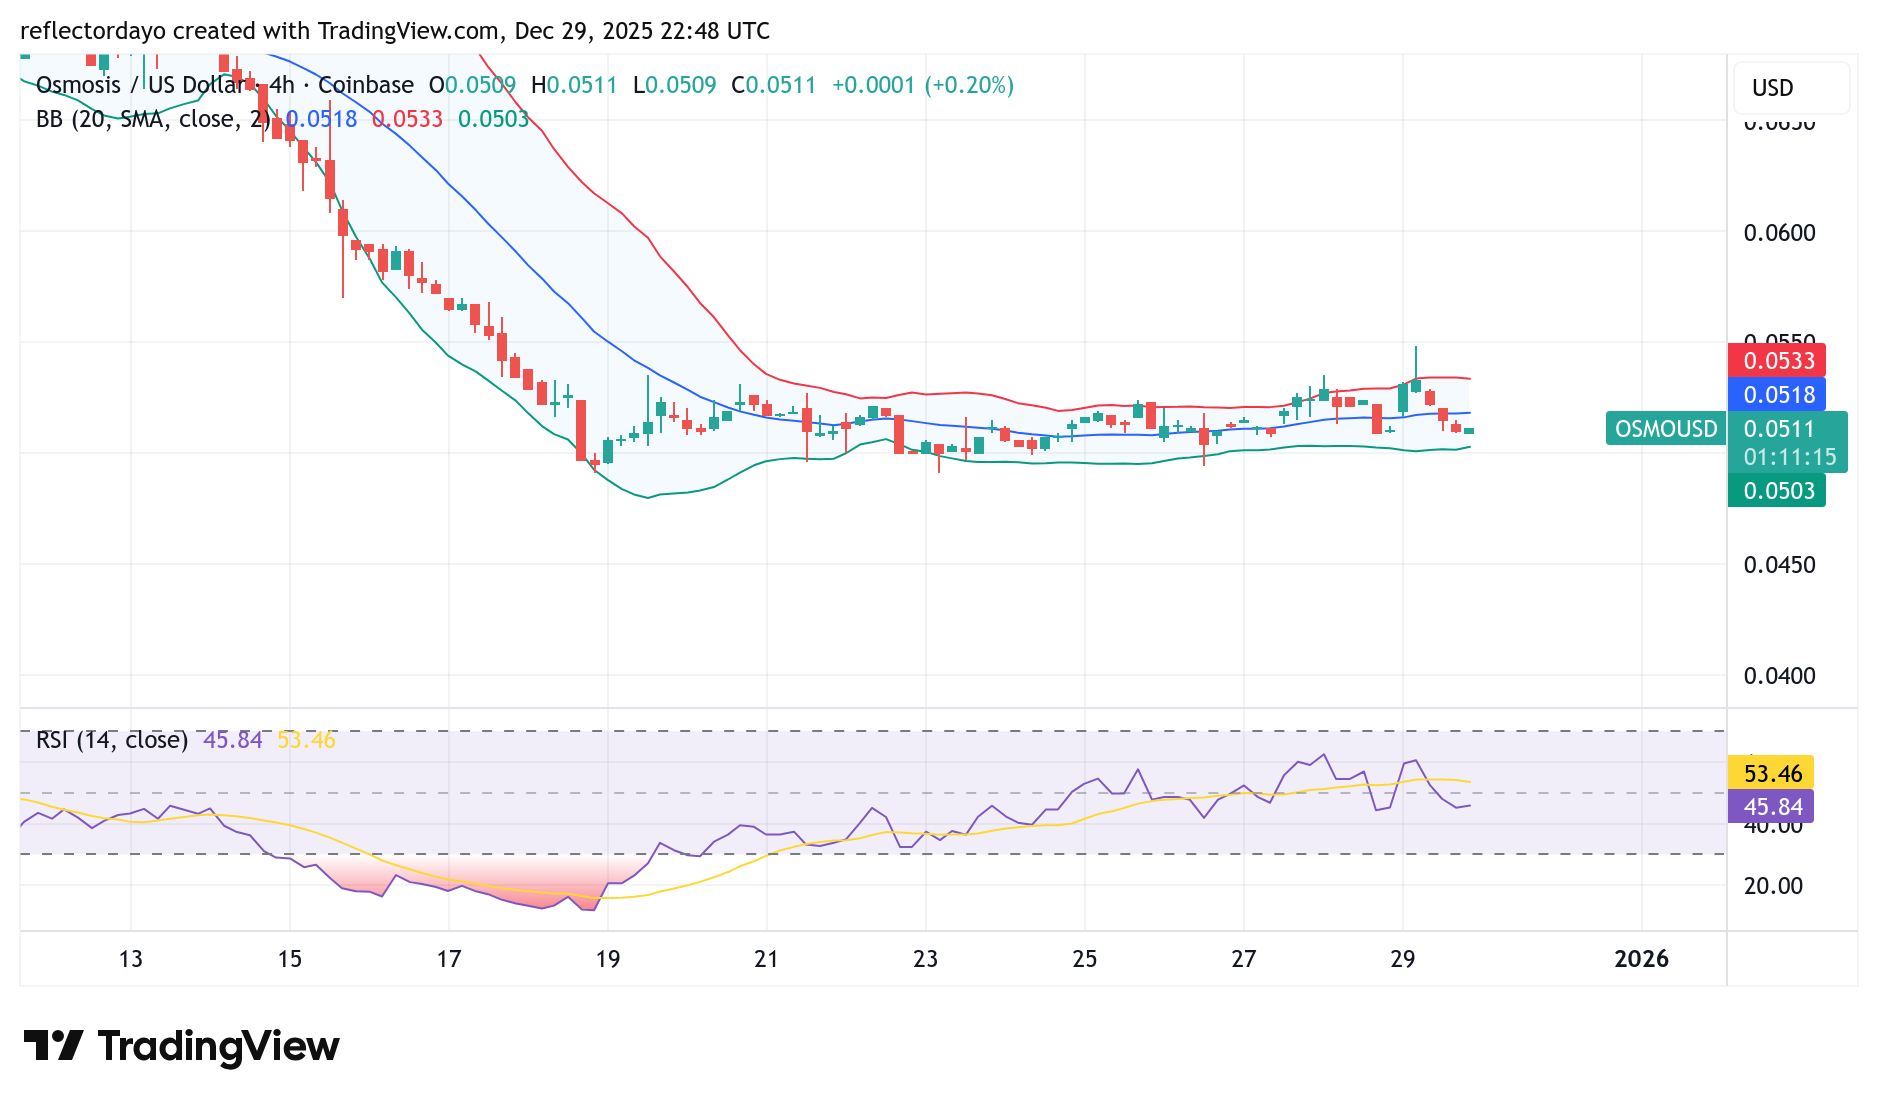
OSMO/USD 4-Hour Chart Outlook
Zooming into the 4-hour timeframe, the Osmosis market shows signs of consolidation accompanied by a gradual upward bias. While price action remains range-bound, a subtle ascent is developing, which is also reflected in the Relative Strength Index (RSI). This suggests that bullish momentum is slowly building, even as broader bearish pressure persists.
However, bullish strength has not yet been sufficient to trigger a decisive breakout. Earlier today, bulls gathered enough momentum to attempt a move higher but were rejected at the $0.055 price level during the second 4-hour trading session. This rejection confirms $0.055 as a short-term resistance level.
Despite this setback, the market continues to maintain a gradual upward structure. If this steady ascent is sustained, the $0.055 resistance level may eventually give way to renewed buying pressure.