PCardano (ADA/USDT) Gears Up for Breakout as Bulls Eye Higher Ground
Estimated Reading Time: 3 minutes
Don’t invest unless you’re prepared to lose all the money you invest. This is a high-risk investment and you are unlikely to be protected if something goes wrong. Take 2 minutes to learn more
Cardano Long-term Analysis: Bullish
Cardano against the Tether is showing an early sign of bullish revival this week, moving towards the $1.000 psychological level after recording over 7% gain. However, the market for this pair appears to be improving after months of short-term pullbacks and extensive sideways movement as the pair builds a potential base around $0.7100 for continued upside movement.
Recently, Cardano has been moving around a region in between the key moving averages. However, current price action shows the pair is ready for a northbound journey as the price slightly hit above the moving average ribbon while the Stochastic RSI sloped upward.
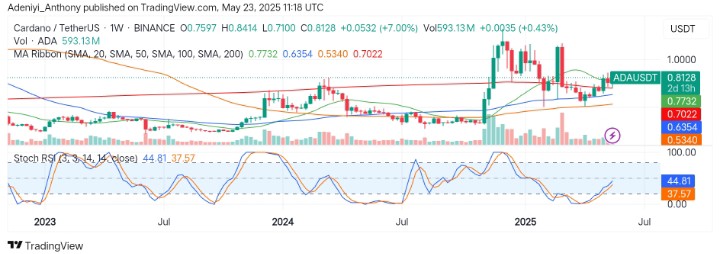
Currently, Cardano trades at $0.8128, printing over 593 million traded volumes for the week.
Technical Indicators
Major Resistance Levels: $0.8163, $0.9000, and $1.0000
Major Support Levels: $0.7732, $0.6354, and $0.5340
Cardano Technical Analysis
The analysis for Cardano against the Tether on the weekly timeframe shows the pair’s price is rising from a low, slightly crossing above a group of simple moving averages. However, the volume appears to be rising alongside the price, validating an intended bullish breakout as the pair heads for the $1.000 level.
From another angle, the Stochastic RSI seems to be stepping up from an oversold region, showing a bullish reversal setup and more improvement ahead as the lines head into the 50-mark level.
To this end, a close above $0.8400 may guarantee a move above $1.000 in the near term.
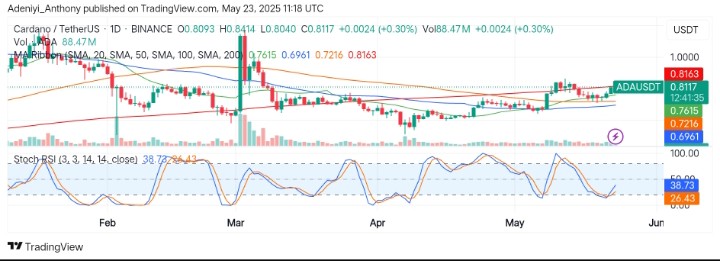
ADA/USDT Analysis: Can the Bulls Maintain Momentum?
On the daily chart, ADA/USDT has shown resilience by hanging around the $0.7500 to $0.8000 level despite recent volatility. However, the recent rise in price indicates a building bullish pressure as the price seeks a position above the long-term key moving average around $0.8163.
On the other hand, the Stochastic oscillator shows the pair prepares for a potential upside continuation as the lines point upward from the 30-mark level. However, the volume on the daily chart appears to be modest, and more is needed for an obvious northbound movement.
To this end, with sustained momentum, a move above $0.8163 would indicate a move towards $1.000 in the near term; otherwise, a break below $0.7615 would invalidate the progress.
You can purchase crypto coins here. Buy LBlock