Polkadot (DOT/USDT) Consolidates for Bullish Gains Amidst Market Volatility
Estimated Reading Time: 3 minutes
Don’t invest unless you’re prepared to lose all the money you invest. This is a high-risk investment and you are unlikely to be protected if something goes wrong. Take 2 minutes to learn more
The market for Polkadot against Tether in the last 24 hours has recorded a loss of 1.21%, falling to $1.80. This displays the height of underperformance recorded by the pair as the broader market records a marginal gain of 0.62%.
Analysts are of the opinion that the mixed ecosystem concerns and the dominance of Bitcoin over the altcoins are the major reasons for this technical breakdown.
Currently, Polkadot trades at $1.826, with more than 1.29 million traded volumes at the moment.
Technical Indicators
Major Resistance Levels: $1.842, $1.973, and $2.020
Major Support Levels: $1.800, $1.787, and $1.700
Technical Analysis
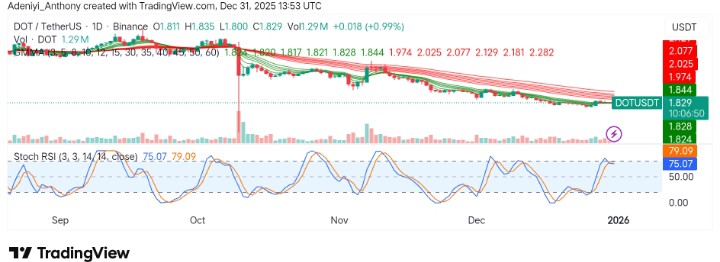
Technically, the price action on the daily chart for Polkadot against Tether shows a potential bullish reversal as the price hovers above the $1.800 support level. However, the GMMA shows the bears are still in control, with the long-period EMAs hovering above the short-period EMAs. Meanwhile, the current consolidation setup signals that there might be a breakout to the north, but the $2.00 threshold needs to pierced from below.
On the other hand, the Stochastic RSI reads 75.13, indicating that the market’s temporary bullish condition is approaching its end, as the lines curl downward from the overbought zone.
However, for bullish moves, the resistance levels at $1.842 and $1.973 need to be broken; otherwise, the pair remains range-bound.
Polkadot’s Update
Recent analysis on Polkadot has revealed that the token is one of those coins that leaves clues and reacts to every marked level. Some weeks ago, the token appeared to be priced above $2.00, with the major resistance around $3.5, showing signs of an intending upside move. However, heavy flows around the formed neckline need to be in favor of the bulls.
As it stands, analysts are placing much importance on the neckline area, as a strong move above $2.00 would determine the strength of an uptrend or otherwise.
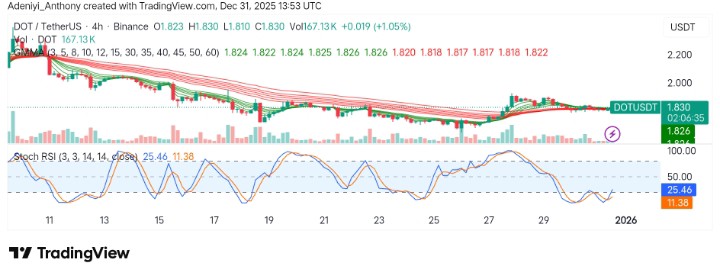
DOT/USDT Analysis: Stoch RSI Oversold, What’s Next?
On the 4-hour chart, the price has been consolidating around the $1.815 level with minor fluctuations. Meanwhile, the GMMA appears to be showing mixed signals, suggesting a possible divergence forming as the short-term averages start to flatten.
From another angle, the stochastic RSI reads 24.62, indicating that the market might be primed for a short-term reversal if the bulls can build momentum around the current condition, and the $1.800 continues to continue.
You can purchase crypto coins here. Buy Crypto