Polkadot (DOT/USDT) Faces Rejection at Key Level Amid Market Volatility
Estimated Reading Time: 3 minutes
Don’t invest unless you’re prepared to lose all the money you invest. This is a high-risk investment and you are unlikely to be protected if something goes wrong. Take 2 minutes to learn more
Polkadot Long-term Analysis: Bearish
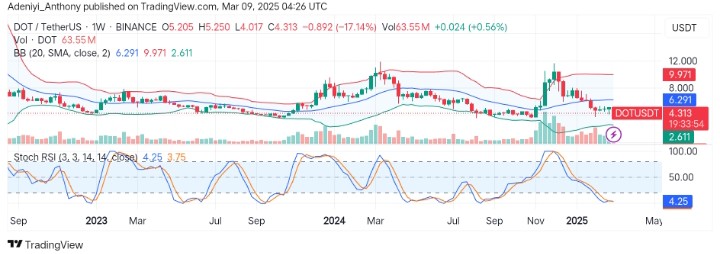
On a weekly timeframe, Polkadot against the Tether has experienced a sharp decline, closing with a two-digit percent loss from the week’s opening price. The market has shown strong pressure from the sellers, evidenced by the heightened sell-off volume of 63.55 million.
Sometimes at the beginning of the year, the pair was operating above $9.971. However, the recent price actions suggested the pair faced challenges breaking above resistance levels. To this end, the expanding Bollinger bands and the positioning of the Stochastic oscillator suggest a possible future price rebound.
Currently, Polkadot trades at $4.313, with a decline in price of about 17%.
Technical Indicators
Major Resistance Levels: $6.291, $8.000, and $9.971
Major Support Levels: $4.017, $2.611, and $2.000
Polkadot Technical Analysis
The analysis for Polkadot against Tether on a 7-day timeframe shows that the pair is currently trading under the middle Bollinger band, suggesting a bearish trend. However, the bands seem to be widening, signaling increased volatility in the near term.
On the other hand, the Stochastic RSI signals a potential upside movement for the pair as the lines of the indicator operate deep in the oversold region. This suggests an upside improvement towards the north, but there is no clear bullish signal yet.
To this end, the overall market sentiment remains bearish; a move toward $6.291 would indicate a trend reversal, while a break below $4.000 would signal a current trend continuation.
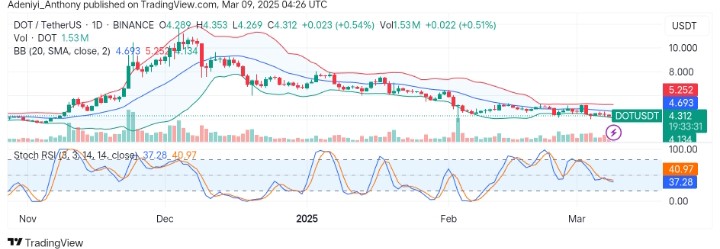
DOT/USDT Analysis: Stabilizing Despite Low Volume
On the daily timeframe, DOT/USDT currently ranges within a tight level, struggling to gain momentum for either side. The price hovers around the lower band, suggesting an oversold condition and the possibility of a short-term recovery in the near term.
The Stochastic RSI at the bottom of the chart, however, captures the directionless situation, as the lines operate in a neutral position. To this end, more bullish traders are needed for the price to break above $4.693; otherwise, sustaining the current momentum will lead to a further decline.
You can purchase crypto coins here. Buy LBlock