Polkadot Price Prediction: DOT Breaches Key Psychological $2.00 Support
Estimated Reading Time: 4 minutes
Don’t invest unless you’re prepared to lose all the money you invest. This is a high-risk investment and you are unlikely to be protected if something goes wrong. Take 2 minutes to learn more
Polkadot (DOT) in the last 24 hours has experienced a 4% decline. This shows the coin is currently underperforming the broader digital asset market. This downturn in the Polkadot price prediction can be traced primarily to a technical breach of the critical $2.00 support level, alongside diminishing momentum from its recent Robinhood listing as investors engage in strategic profit-taking.
As it stands, the market is experiencing a prevailing “extreme fear” sentiment, reflected in the Crypto Fear & Greed Index, suggesting an intensified sell-side pressure on altcoins. To this end, analysts are suggesting that unless the token reclaims key psychological thresholds, persistent bearish indicators and shifting liquidity may continue to determine the Polkadot price prediction.
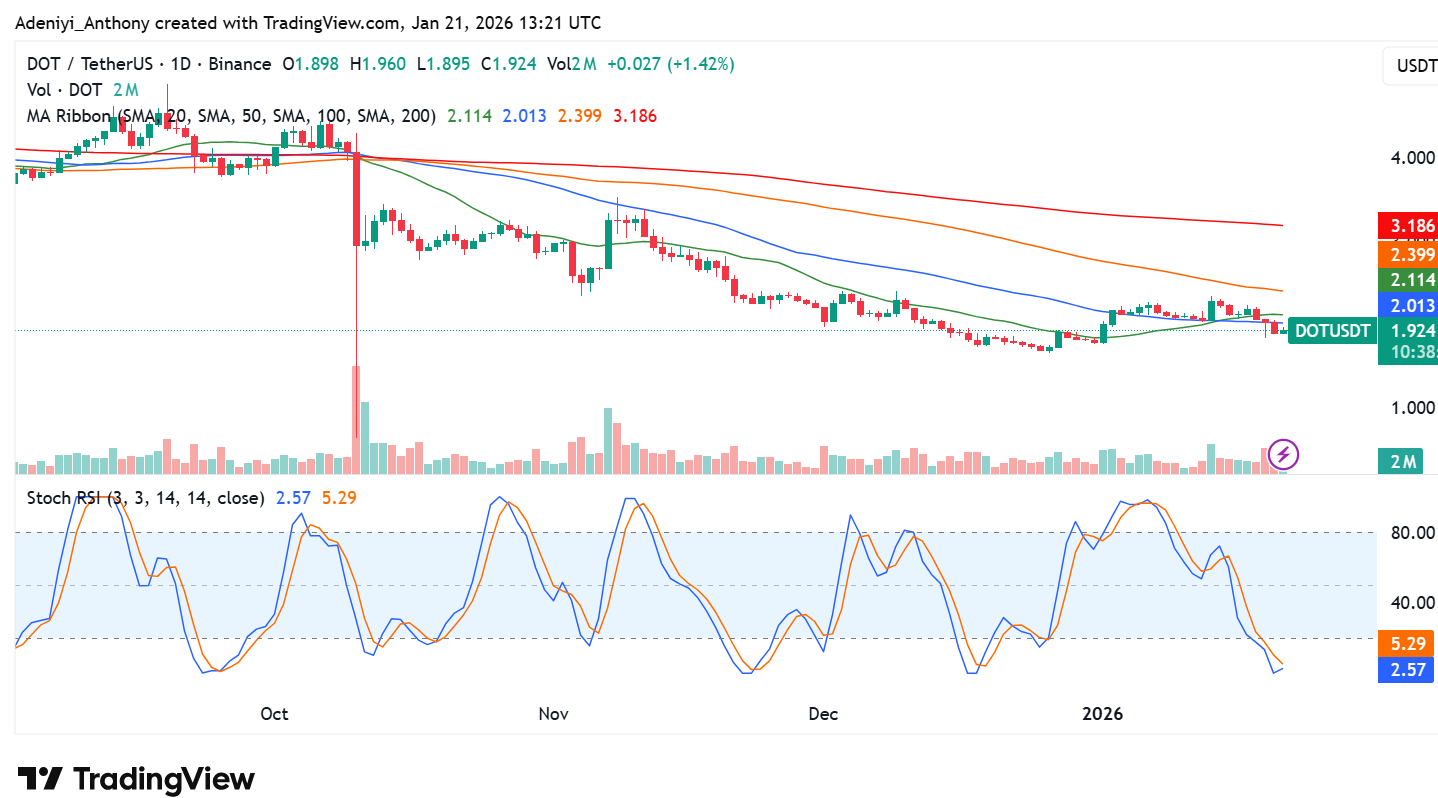
Currently, Polkadot trades at $1.924 with over 252,000 traded volumes on the daily timeframe.
Technical Indicators
Major Resistance Levels: $2.114, $2.240, and $2.480
Major Support Levels: $1.850, $1.700, and $1.660
Technical Analysis
Technically, Polkadot against Tether in recent times has seen extensive bearish control, failing to hold above the major moving average lines. However, recent price action suggests recovery in the coming session with the development of a slight bullish intent on the daily timeframe. This chart shows that despite the bearish effort exerted on the market, the bulls appear to be taking actions strategically.
As it stands, the price is trading under the $2.013 resistance level with a slightly improving level; the Stochastic RSI appears to be suggesting the Polkadot price prediction may favor the bulls soon, but a clear bounce above the $2.114 level must be seen to confirm such; otherwise, a further dip is expected.
Polkadot Price Prediction and Update
Earlier in 2026, Polkadot appeared to be facing significant sell-side pressure, dropping nearly 10% in the last 24 hours as sellers reclaimed market control. The asset has breached the key psychological $2.20 support zone, with increasing volume on the dip confirming aggressive distribution by major holders.
Despite this volatility, the long term relies heavily on the historic tokenomics overhaul set for March 14, 2026. This “Hard Pressure” model will introduce a 2.1 billion DOT supply cap and Bitcoin-style issuance reductions. To this end, while bulls must reclaim the $2.30 resistance to signal recovery, the ecosystem’s transition toward scarcity remains a pivotal fundamental catalyst for the year.
DOT/USDT Analysis: Bearish Momentum Accelerates on Volume Spikes
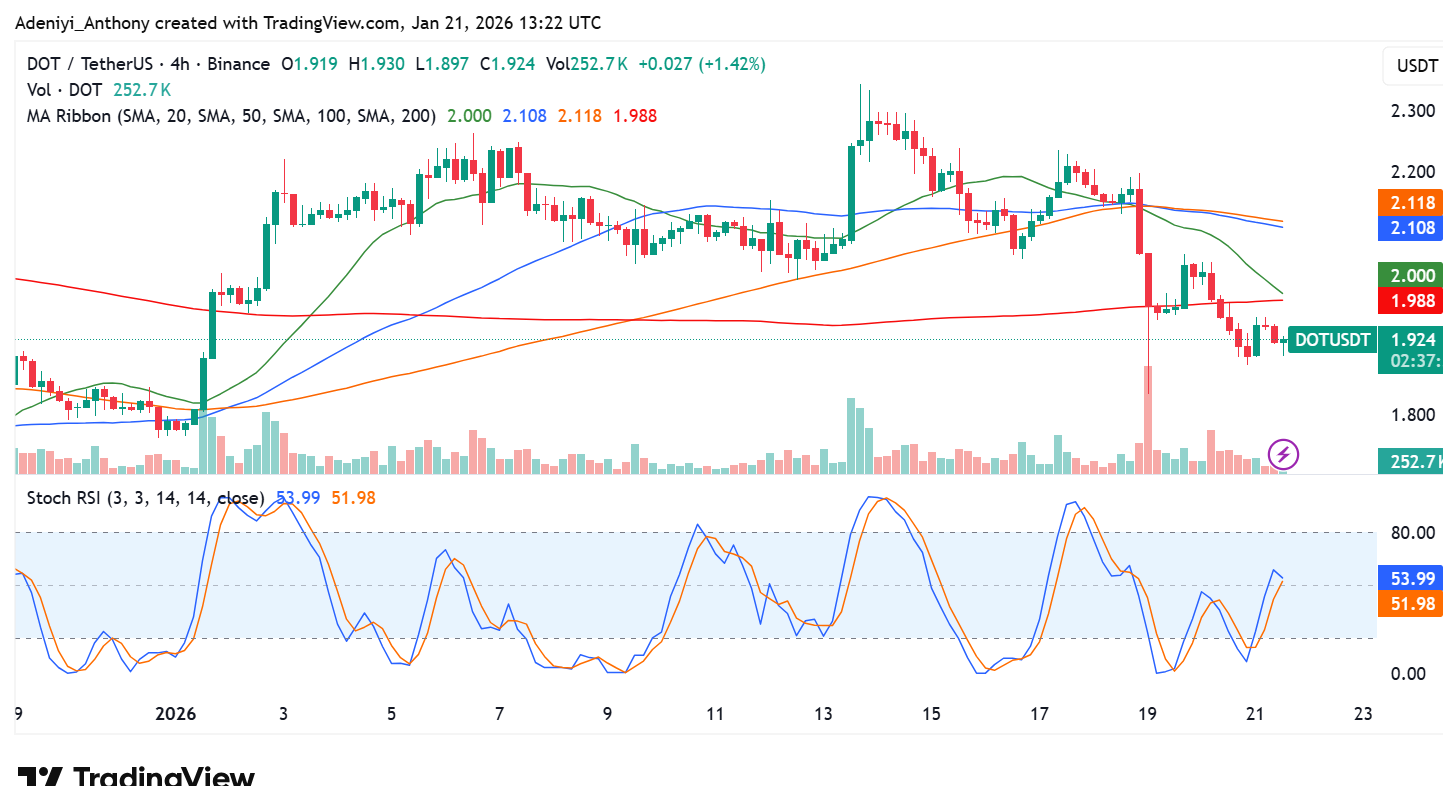
On the 4-hour chart, DOT/USDT seems to be displaying a bearish configuration, with the price operating beneath the cluster of the SMA as the 50-period moving average trends downward and acts as dynamic resistance. At the moment, the technical oscillator beneath the chart suggests that downside momentum is accelerating rather than stabilizing. This can be seen in the recent behavior of the lines as the blue line bends abruptly to the south.
To this end, unless the token quickly reclaims the $2.05–$2.10 short-term support-turned-resistance zone, the Polkadot price prediction tilts towards $1.70.
You can purchase crypto coins here. Buy Crypto