XRP Reaches Bearish Fatigue as It Hovers Above $0.5687
Estimated Reading Time: 2 minutes
Don’t invest unless you’re prepared to lose all the money you invest. This is a high-risk investment and you are unlikely to be protected if something goes wrong. Take 2 minutes to learn more

XRP (XRP) Long-Term Analysis: Bearish
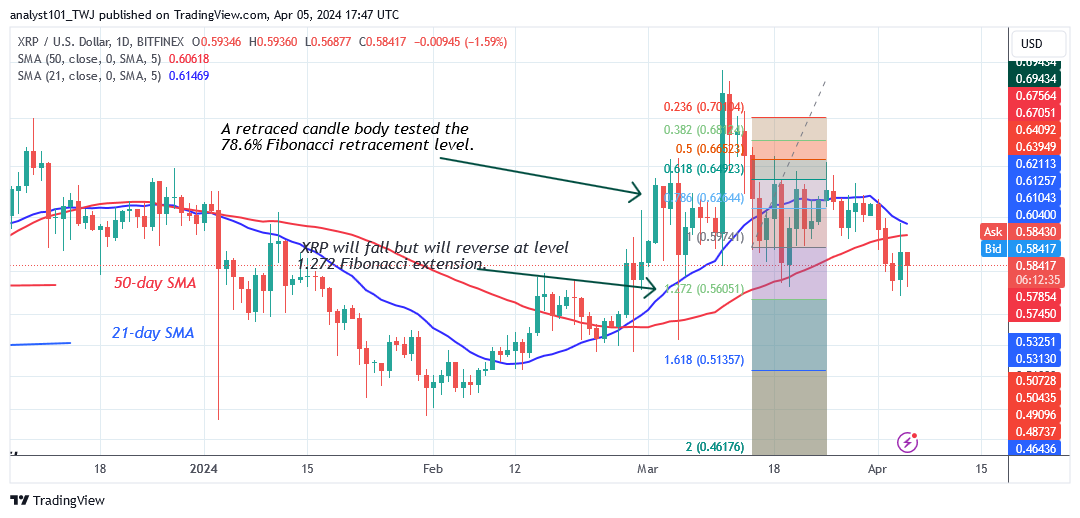
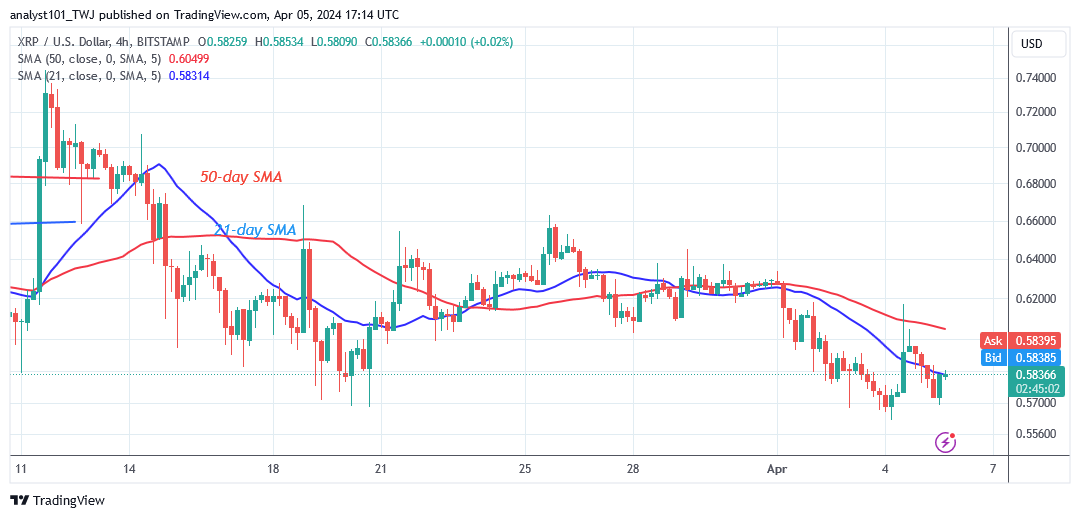
The price of XRP (XRP) has dropped below the moving average lines as it hovers above $0.5687. The altcoin fell to a low of $0.566 as bulls purchased dips. XRP rose but was rebuffed at the 50-day SMA. On the downside, the altcoin will drop, but the bearish trend will reverse. On the March 15 fall, the altcoin reversed upward, with a candle body testing the 78.6% Fibonacci retracement level.
The correction predicts that XRP will decline but then reverse at the 1.272 Fibonacci extension, or $0.5605. Meanwhile, the XRP/USD exchange rate stands at $0.5861 as of this writing.
Technical Indicators:
Major Resistance Levels – $1.00, $1.50, $2.00
Major Support Levels – $0.50, $0.30, $0.10
XRP (XRP) Indicator Analysis
The cryptocurrency price bars are below the moving average lines, which were previously stuck in a range. On the 4-hour chart, the price bars are between the moving average lines as the cryptocurrency corrects upwards. The moving average lines are sloping horizontally, indicating a sideways trend.
What Is the Next Direction for XRP (XRP)?
The crypto asset is declining as it hovers above $0.5687. On the 4-hour chart, the cryptocurrency price retested the present support level of $0.57 and rebounded. On the upside, the altcoin will resume its bullish trend if XRP recovers above the current support and breaks above the moving average lines or the $0.64 resistance. The cryptocurrency’s signal is range-bound and below the moving average lines.
You can purchase crypto coins here. Buy LBLOCK
Note: Cryptosignals.org is not a financial advisor. Do your research before investing your funds in any financial asset or presented product or event. We are not responsible for your investing results