Polygon (ex-MATIC) Price Prediction: POL/USDT Rises Back Above the $0.2000 Price Mark
Estimated Reading Time: 3 minutes
Don’t invest unless you’re prepared to lose all the money you invest. This is a high-risk investment and you are unlikely to be protected if something goes wrong. Take 2 minutes to learn more
Date: June 6, 2025
The Polygon (ex-MATIC) token has experienced a notable price recovery, as price action in this market has resurfaced above the technical level of $0.2000. Although price action still generally remains below some key technical levels, trading indicators are beginning to shape up, suggesting the possibility of further price recovery in this market.
POL/USDT Long-Term Trend: Bearish (Daily Chart)
Key Price Levels:
Resistance: $0.2250, $0.2500, $0.2750
Support: $0.2000, $0.1750, $0.1500
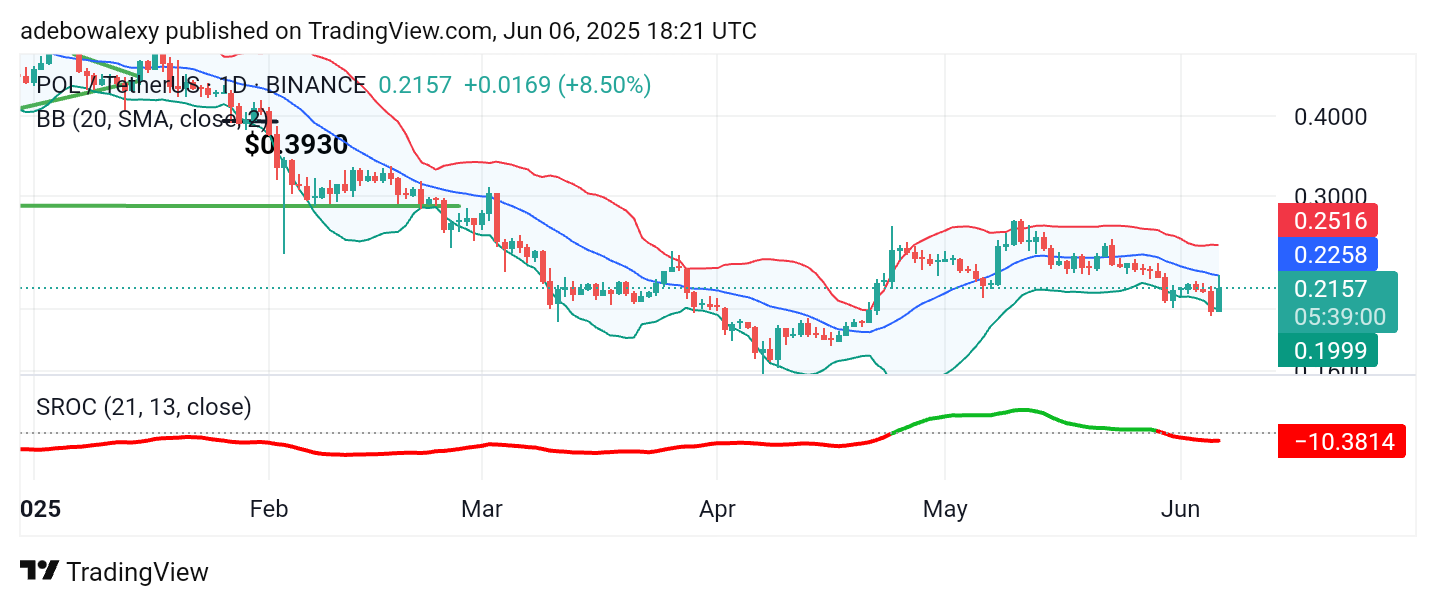
The latest price candle on the Polygon (ex-MATIC) daily chart is bullish. It is represented by a green and conspicuous price candle standing just above the lower limit of the Bollinger Bands. Meanwhile, price action still lies below the middle Bollinger Band. Similarly, the Smoothed Rate of Change (SROC) indicator line is now below the equilibrium level but is tending sideways due to the recent upside price retracement.
Polygon (ex-MATIC) Price Prediction: POL/USDT Still Shows Vulnerabilities
It is worth noting that price action on the Polygon (ex-MATIC) daily chart remains below the middle band of the Bollinger Bands. As a result, the current session’s price candle has shown some downward contraction, visible through an upper shadow on the candle.
Furthermore, the lines of the SROC indicator have descended below the equilibrium level. As a result, the terminal end of the indicator line appears red, even as it trends sideways below the equilibrium line. These factors indicate that while the token has experienced a notable price increase, headwinds could still introduce setbacks.
Polygon (ex-MATIC) Price Prediction: POL/USDT Has a Short-Term Prospect
Price activity in the Polygon (ex-MATIC) market has moved above the middle band of the Bollinger Bands indicator on the 4-hour chart. The market tested the $0.2250 price level in the previous session but retreated via a downward contraction.
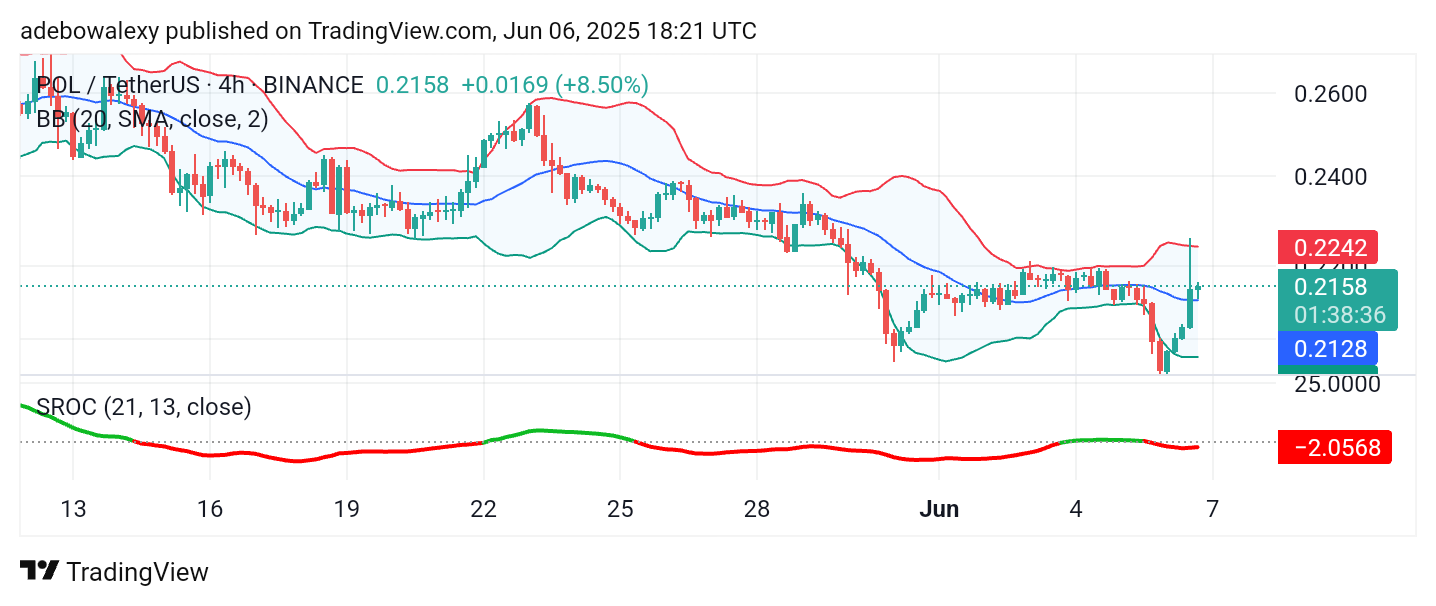
Nevertheless, the latest price candle is green and positioned above the middle Bollinger Band. Additionally, the SROC line is still below the equilibrium level but is slowly trending upward, approaching it as a resistance level. With that in mind, traders may aim for the $0.2250 price level in the short term.