Polygon (Prev. MATIC) (POL/USD) Gains Further Upward Traction
Estimated Reading Time: 3 minutes
Don’t invest unless you’re prepared to lose all the money you invest. This is a high-risk investment and you are unlikely to be protected if something goes wrong. Take 2 minutes to learn more

Since the beginning of the year, Polygon (prev. MATIC) has been trending in favor of bullish participants. Although the upward movement since January 1 has been gradual, today’s trading session has seen a notable acceleration in momentum, with the price gaining around 11.15% on the day. As POL/USD approaches the $0.15 price level, the market is now facing an initial resistance test, where traders are closely watching for signs of either a breakout or a temporary pause in the rally.
Polygon (Prev. MATIC) (POL/USD) Market Data
- POL/USD Price Now: $0.15
- POL/USD Market Capitalization: $1.57 billion
- POL/USD Circulating Supply: 10.6 billion
- POL/USD Total Supply: 10.6 billion
- POL/USD CoinMarketCap Ranking: #48
Investor confidence is returning in the Polygon (prev. MATIC) market.
Key Levels to Monitor
- Resistance: $0.155, $0.160, $0.164
- Support: $0.120, $0.110, $0.100
Polygon Ecosystem Token Market Analysis: Technical Viewpoint
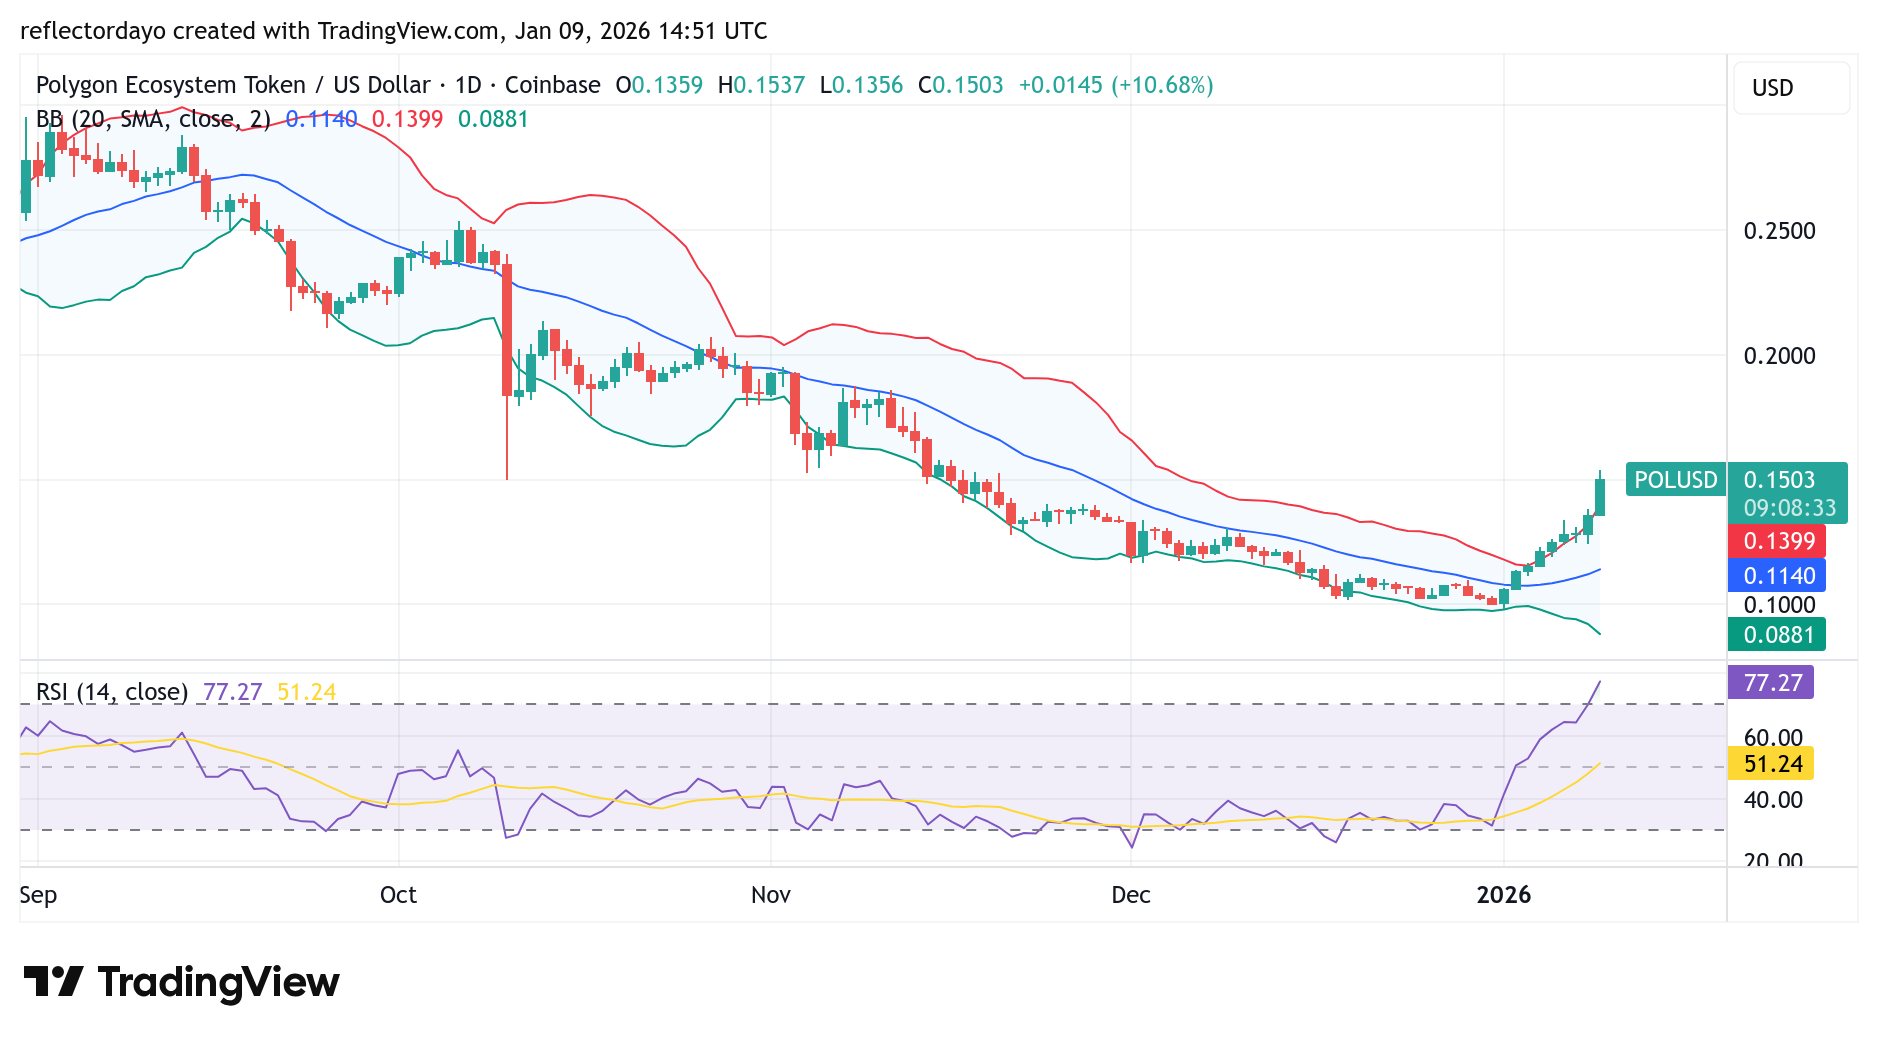
Despite the appearance of a strong bullish candlestick—characterized by a solid green body and a relatively small upper shadow—the market clearly reflects a strong and prevailing bullish sentiment. However, it is important to note that the current price action still represents a bullish recovery phase, rather than a fully established uptrend.
Previously, the market had been in a sustained decline, particularly after the price failed to hold above the $0.24 level in October last year. This downturn continued until the market found firm support around the $0.10 price level. Given the critical nature of this support zone, traders appear to have regained confidence, which has helped fuel the current upside recovery and strengthened expectations for further bullish continuation.
POL/USD 4-Hour Chart Outlook
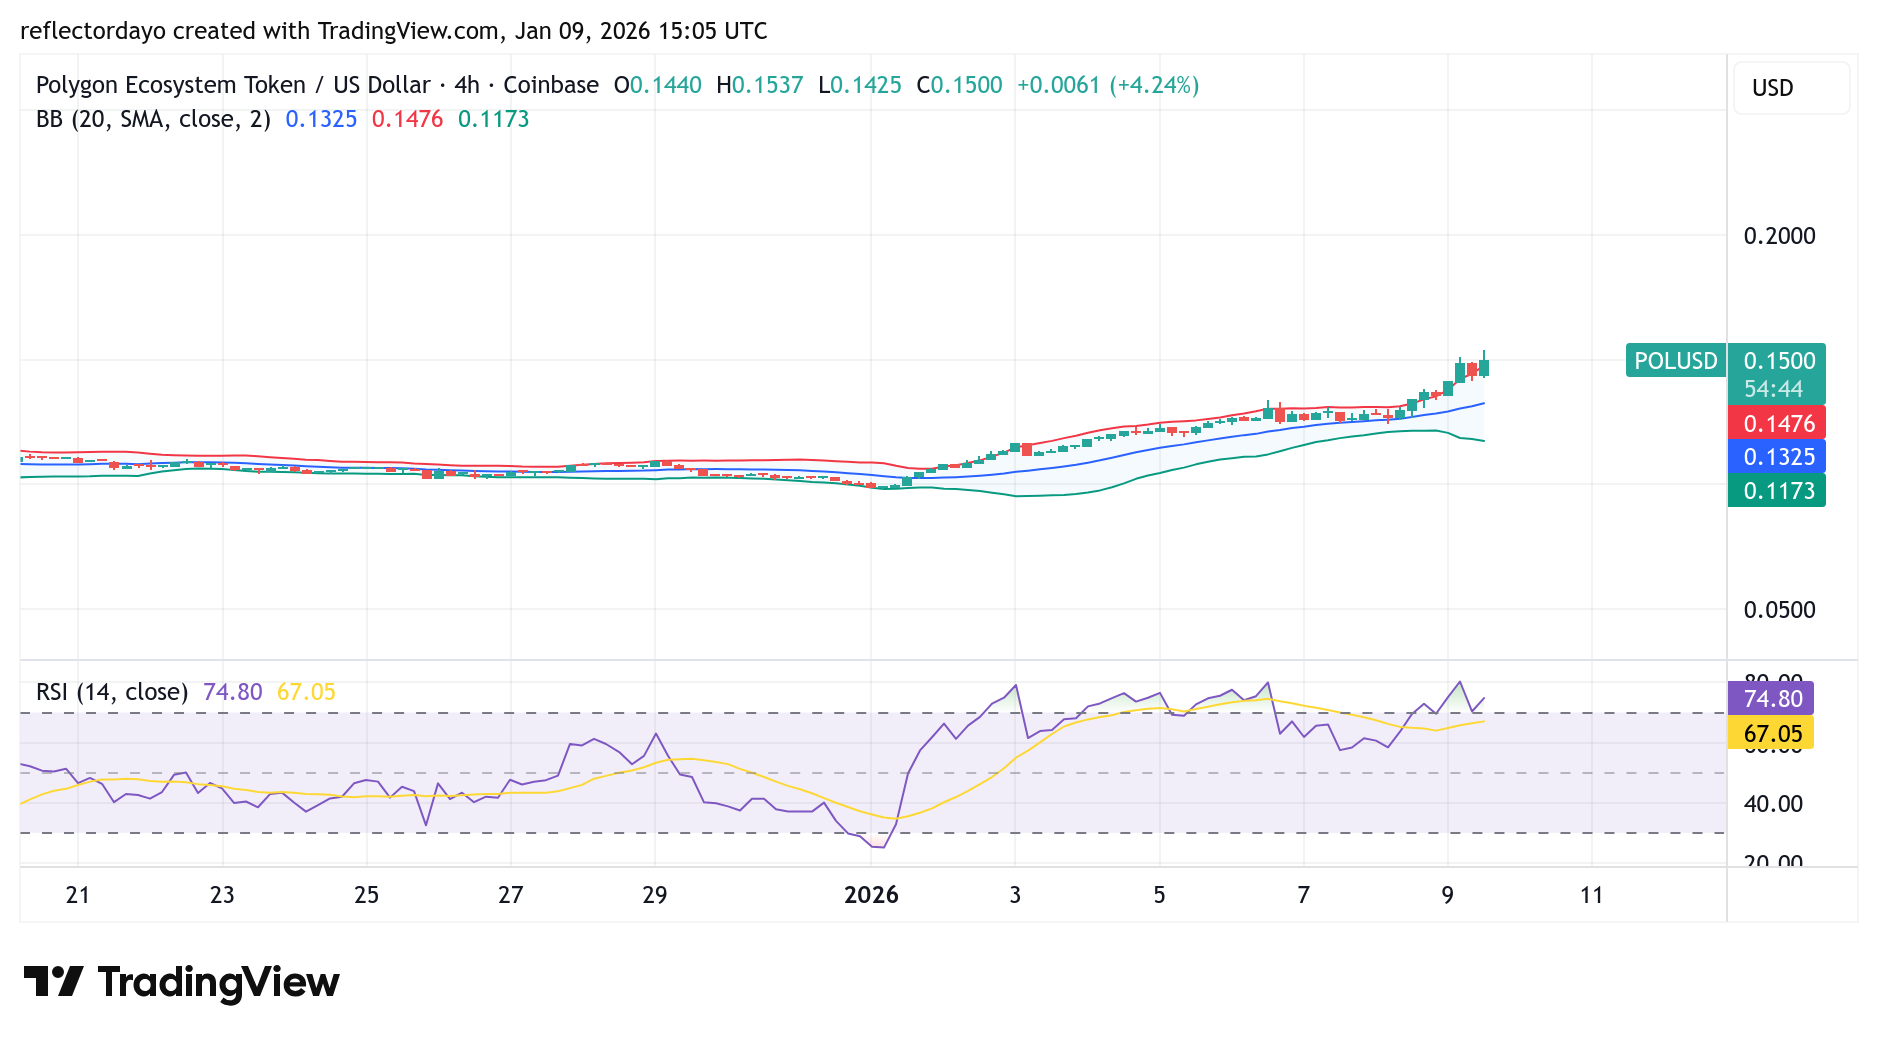
Although technical indicators are beginning to signal overbought conditions in the Polygon (prev. MATIC) market, price action suggests that traders remain optimistic. A nearby support level has formed around $0.142, just below the $0.15 resistance zone, helping to build buying pressure against this critical level.
If this support continues to hold, the likelihood of a sustained breakout above the $0.15 price level increases, potentially opening the door for further upside movement.
Market reactions speak volumes. A reminder that narratives matter—but so does long-term performance.
“People in disbelief 👀”
And this is just the chart after you decided to erase 2 years of underperformance, $MATIC top was at $3
All of this because you went all-in on the L2 narrative using 4 different L2s (no idea why) and none of them got any traction
And don’t even get me… https://t.co/z2ejAmmtf2 pic.twitter.com/e9XxYnoVnm— Joestar⭐ (@JoestarCrypto) January 9, 2026