Render Token (RENDER/USD) Poised for Breakout Above $4.00
Estimated Reading Time: 3 minutes
Don’t invest unless you’re prepared to lose all the money you invest. This is a high-risk investment and you are unlikely to be protected if something goes wrong. Take 2 minutes to learn more
Although the Render Token (RENDER/USD) market has been consolidating between the key resistance at $4.00 and support around $3.40, recent price action suggests that a breakout may be on the horizon.
This extended consolidation phase has allowed the market to build momentum. Now, several technical indicators and the overall price behavior are beginning to reveal signs of a potential bullish breakout. Traders and investors should closely monitor this zone, as a decisive move above the $4.00 level could signal the start of a stronger upward trend.
The Render Token Market Data
- RENDER/USD Price Now: $3.853
- RENDER /USD Market Cap: $2 billion
- RENDER /USD Circulating Supply: 517 million RENDER
- RENDER /USD Total Supply: 532 million RENDER
- RENDER /USD CoinMarketCap Ranking: #41
Key Levels
- Resistance: $4.00, $5.00, and $6.00
- Support: $3.50, $3.00, and $2.50.
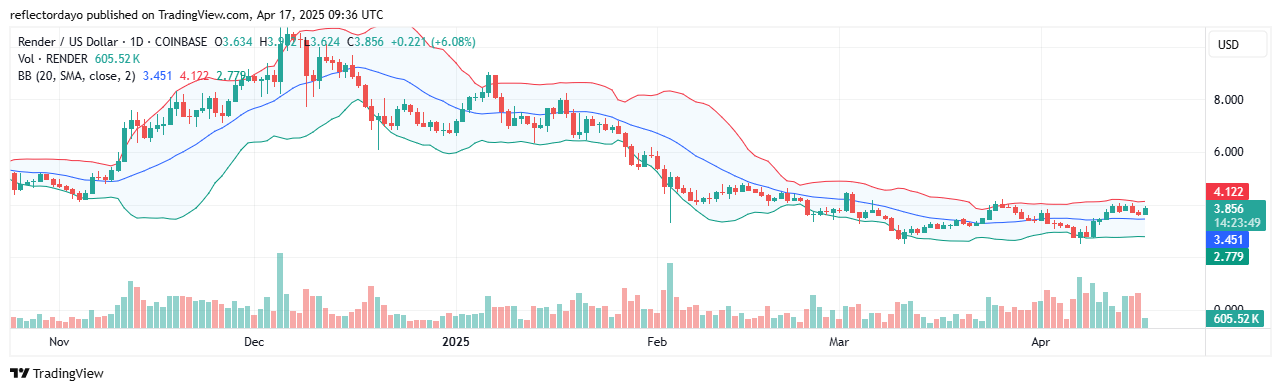
Render Token (RENDER/USD): Technical Indicators Suggest Looming Volatility Shift
Analyzing the Render Token market from the perspective of the daily chart, we observe a continued consolidation phase, with price action moving within a defined range between the $4.00 resistance level and the $3.50 support zone.
Despite the sideways movement, recent developments hint at a potential shift. Trading volume experienced a notable surge recently, and price action has now risen above the 20-day moving average—a positive signal for bullish momentum. However, the $4.00 resistance remains firm, with bears actively rejecting upward moves, while bulls continue to defend higher support levels around $3.60.
This scenario represents a standoff between buyers and sellers in a region still marked by bearish pressure. Interestingly, trading volume has begun to decline again, suggesting that the current consolidation phase may be nearing its end. This decline in volume, coupled with tight price movement, hints at an impending volatility squeeze—a common precursor to a decisive market move.
Given that price is currently positioned above the 20-day moving average, the odds may favor a bullish breakout rather than a breakdown.
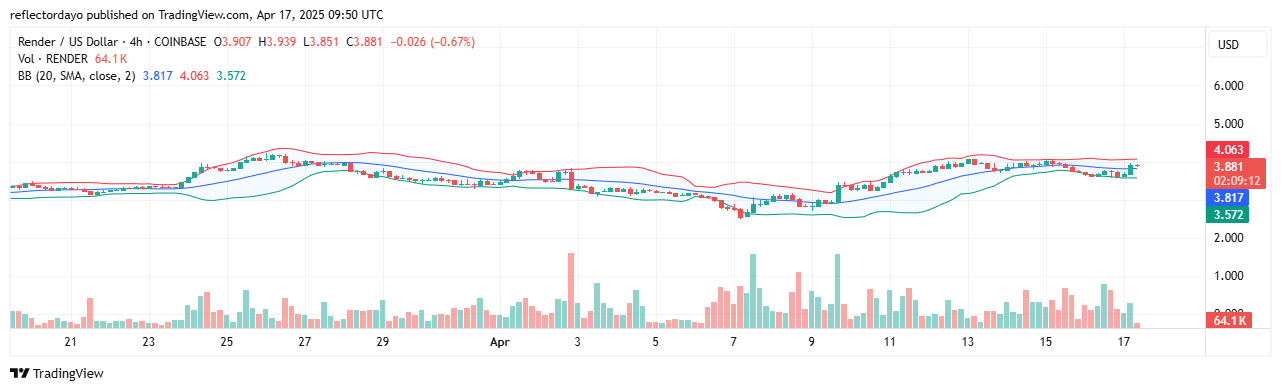
RENDER/USD Price Outlook: Bullish Momentum Builds on 4-Hour Chart
Analyzing the RENDER/USD market from the 4-hour chart perspective reveals an encouraging pattern for bulls. While the $4.00 resistance level continues to hold firm, the formation of a series of higher lows indicates that buyers are gradually closing in on bearish territory.
This price behavior forms what appears to be an ascending triangle pattern—a classic bullish continuation signal. The consistent pressure on resistance, combined with rising support levels around $3.60, suggests that bulls are gaining strength.
If this pattern persists and buyers continue to defend the higher support zone, a breakout above the $4.00 level becomes increasingly likely. Traders should watch closely, as a confirmed breakout could pave the way for a significant upward move.