Ripple Trades in the Overbought Region as It Risks a Decline to $0.31
Estimated Reading Time: 2 minutes
Don’t invest unless you’re prepared to lose all the money you invest. This is a high-risk investment and you are unlikely to be protected if something goes wrong. Take 2 minutes to learn more
Ripple (XRP) Long-Term Analysis: Bearish
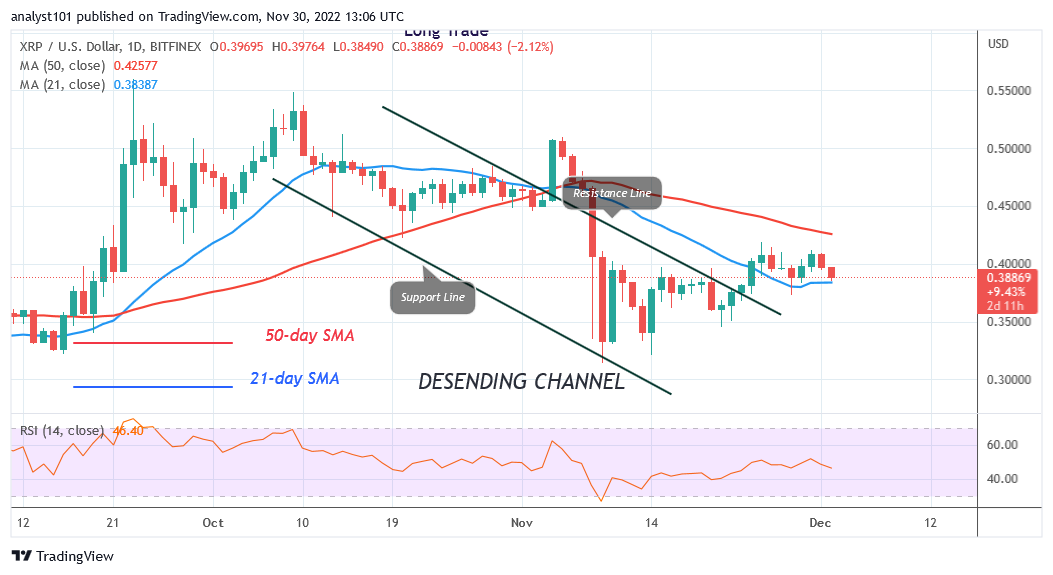
Ripple (XRP) price oscillates between the moving average lines as it risks a decline to $0.31. The consequence is that as long as the moving average lines don’t break, XRP will be forced to trade in a range. In other words, when the range-bound levels are broken, the altcoin will trend. If price breaks below the 21-day line SMA, the altcoin will decline to the range-bound region between levels of $0.31 and $0.40. On the downside, if XRP passes over the 50-day SMA, it might rise to its previous high of $0.55. XRP/USD is currently trading at $0.38 at the time of writing.
Ripple (XRP) Indicator Analysis
On the Relative Strength Index, Ripple is at level 46 for period 14. Despite the upward correction, it is still in the downtrend zone. The moving average lines on the cryptocurrency market indicate sideways movement. The 50-day line and 21-day line SMAs show a downward trend. XRP is experiencing a bearish momentum on the daily Stochastic below level 80.
Technical indicators:
Major Resistance Levels – $2.00, $2.50, $3.00
Major Support Levels – $1.50, $1.00, $0.50
What Is the Next Direction for Ripple (XRP)?
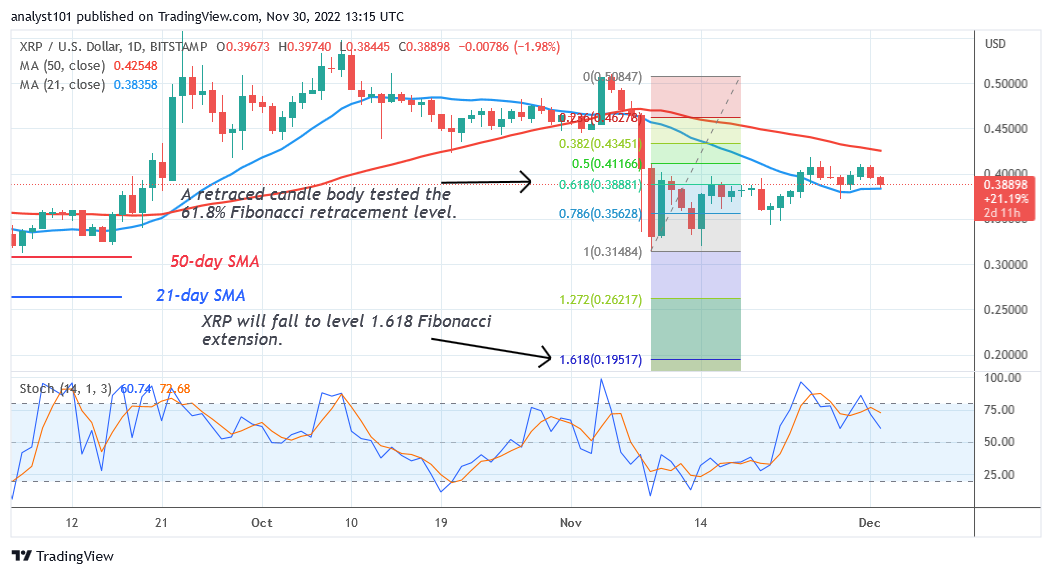
Ripple is plunging as risks a decline to $0.31. As it retests the 21-day line SMA support, XRP is losing ground. If the current support holds, the range move will continue. On the other hand, if the current support holds, the altcoin will fall to a level $0.31 or $0.19.
You can purchase crypto coins here. Buy LBLOCK
Note: Cryptosignals.org is not a financial advisor. Do your research before investing your funds in any financial asset or presented product or event. We are not responsible for your investing results


