Ripple Oscillates but Faces Rejection at the $0.40 High
Estimated Reading Time: 2 minutes
Don’t invest unless you’re prepared to lose all the money you invest. This is a high-risk investment and you are unlikely to be protected if something goes wrong. Take 2 minutes to learn more
Ripple (XRP) Long-Term Analysis: Bearish
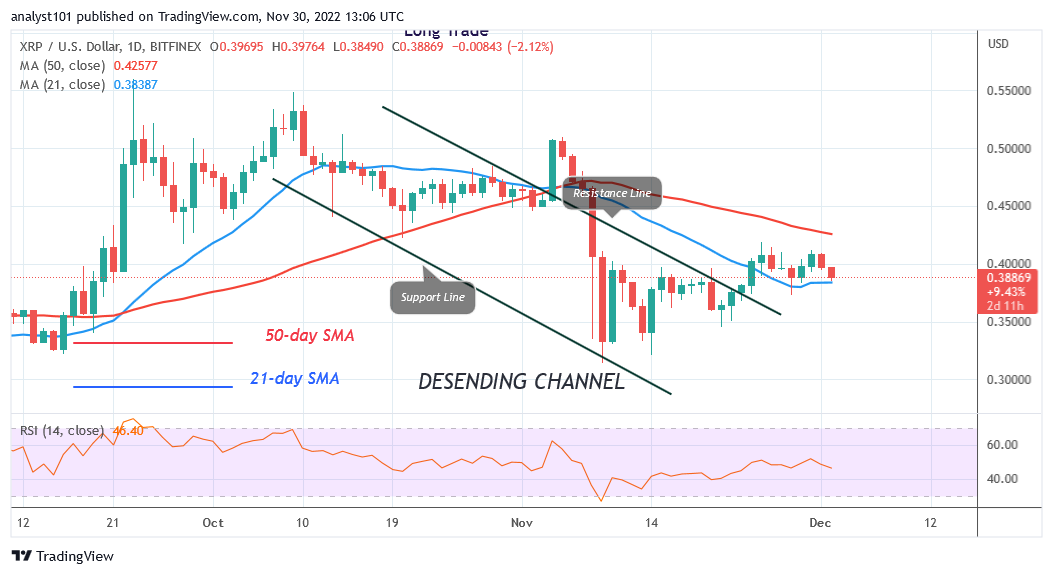
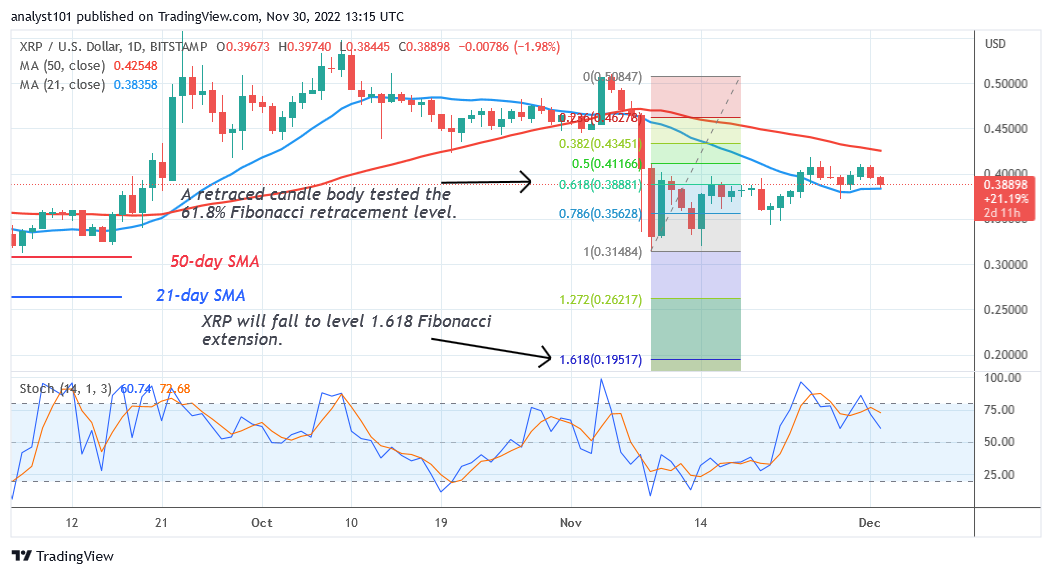
Ripple’s (XRP) price is in a decline as it faces rejection at the $0.40 high. The 21-day line SMA was broken on November 24 as XRP made an upward correction. The bullish momentum was unable to cross the 50-day SMA. XRP has been oscillating inside the moving average lines for the previous week. The altcoin will drop to the range-bound area between levels of $0.31 and $0.40 on the downside if price breaks below the 21-day line SMA. The upside is that XRP will surge to its previous high of $0.55 if it crosses over the 50-day SMA. In the meantime, the moving average lines have contained XRP.
Ripple (XRP) Indicator Analysis
For period 14, Ripple is at level 46 on the Relative Strength Index. After the most recent rejection, it is now in the decreasing zone. As long as the cryptocurrency trades between the moving average lines, it will start to drift sideways again. Both the 21-day SMA and the slope of the 50-day line indicate a declining trend. On the daily Stochastic, XRP is in a bearish momentum below level 80.
Technical indicators:
Major Resistance Levels – $2.00, $2.50, $3.00
Major Support Levels – $1.50, $1.00, $0.50
What Is the Next Direction for Ripple (XRP)?
The price of Ripple is still falling as it faces rejection at the $0.40 high. As it tries to break below the 21-day line SMA, XRP is now dropping. If sellers are successful, the market will fall to the $0.31 support level.
You can purchase crypto coins here. Buy LBLOCK
Note: Cryptosignals.org is not a financial advisor. Do your research before investing your funds in any financial asset or presented product or event. We are not responsible for your investing results