Solana (SOL) Price Prediction: SOL/USDT Gains Bullish Traction
Estimated Reading Time: 3 minutes
Don’t invest unless you’re prepared to lose all the money you invest. This is a high-risk investment and you are unlikely to be protected if something goes wrong. Take 2 minutes to learn more

Solana (SOL) Price Prediction: July 19
The Solana token has started picking up some upside momentum since the previous session. The market had earlier seen a dip but soon rebounded upwards, while today’s trading activity so far has caused price action to resurface above the $160 price level.
SOL/USDT Long-term Trend: Bullish (Daily Chart)
Key Price Levels:
Resistance Levels: $165, $175, and $185
Support Levels: $160, $150, and $140
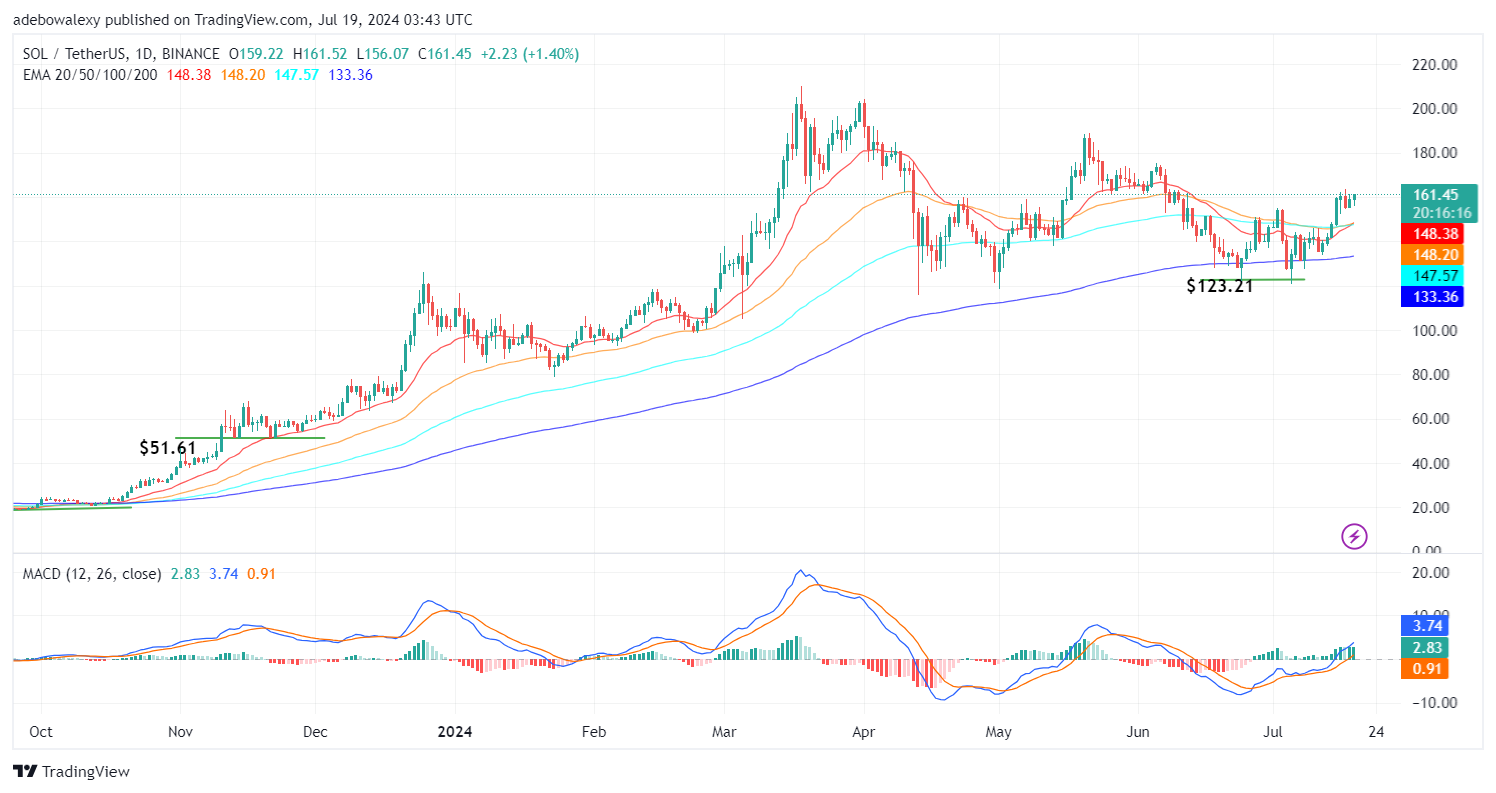
Price action in the SOL/USDT daily market had generally rebounded off the support at the $123.21 price level. However, price action resurfaced above the Exponential Moving Average (EMA) lines over the past five sessions. Price action has been hovering around the $160 level. The ongoing session has placed the price of the token above the $160 level. Also, the 20, 50, and 100-day EMA lines converge for a crossover below the price activity. The Moving Average Convergence Divergence (MACD) lines are above equilibrium, and the lines of this indicator are now solid green.
Solana Price Prediction: SOL/USDT May See More Gains
The technical indicator in the Solana market reveals that upside forces dominate in this market. This time they may cause price action to rise further above the $160 mark. The last price candle, as earlier mentioned, has placed the token above the $160 and $161 price levels.
Additionally, the EMA lines can be seen converging below that price candle, which suggests that price movement may get an additional boost. Meanwhile, the MACD indicator lines can be seen trending upward above the equilibrium level. Also, the bars of the indicator can be seen in solid green. Given all these factors, it is more likely that price action will proceed further up in this market.
SOL/USDT Medium-term Trend: Solana Traders May Be Targeting the $170 Resistance (4H Chart)
Over the past three sessions, price candles can be seen hugging the upper side of the 20-day EMA lines. However, the current session seems ready to change that trend. The last price candle here appears to leap off the 20-day EMA curve.
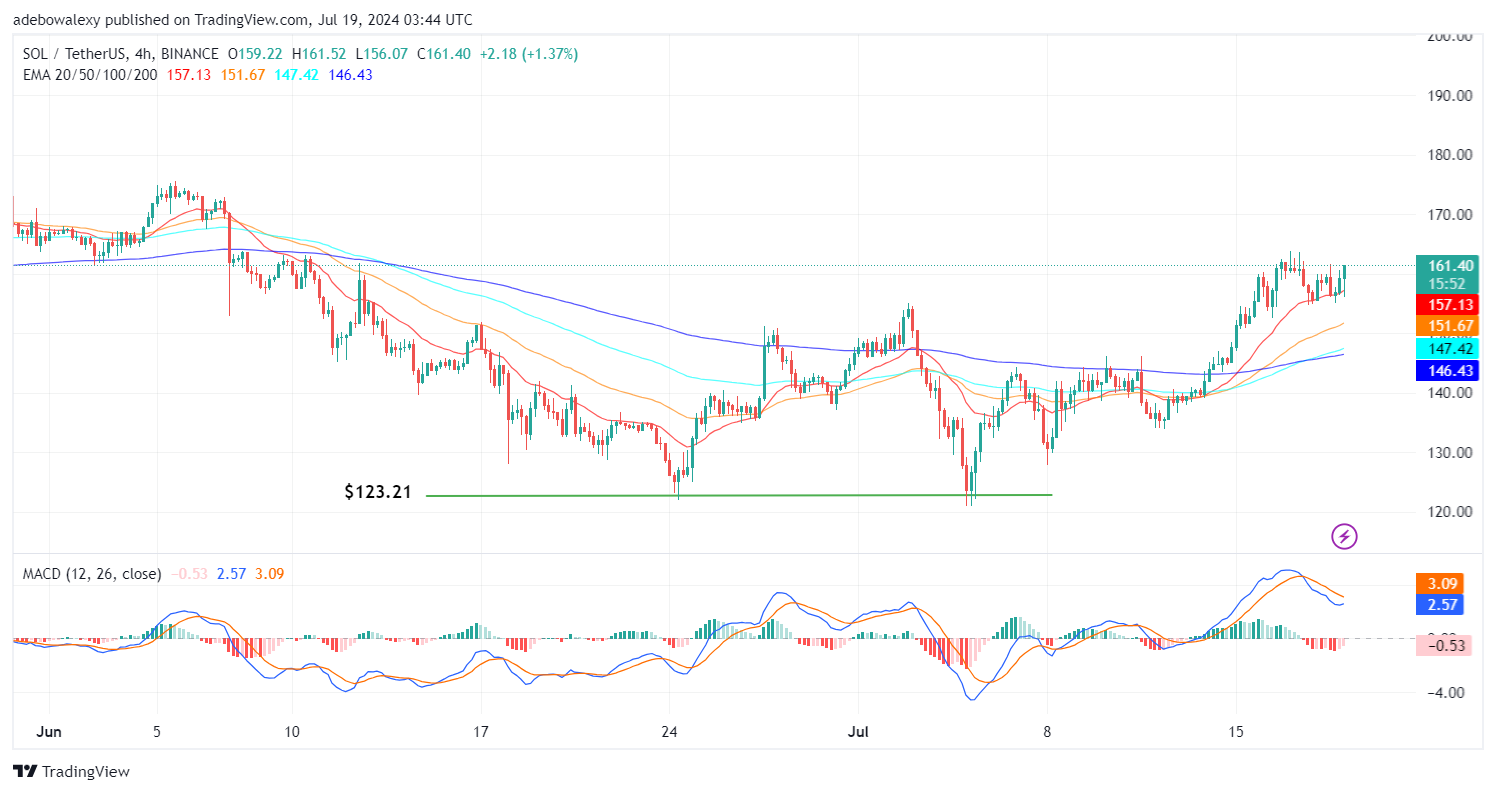
Likewise, the MACD indicator lines are above the equilibrium level and appear to be approaching an upside crossover after a dip. Additionally, the bars of this indicator are now pale red, indicating that headwinds are getting weaker. At this point, if upside forces can keep mounting pressure, they will cause price action to forge further up towards the $165 or $170 price level.