Solana (SOL) Price Prediction: SOL/USDT Hangs Around the $135 Threshold
Estimated Reading Time: 2 minutes
Don’t invest unless you’re prepared to lose all the money you invest. This is a high-risk investment and you are unlikely to be protected if something goes wrong. Take 2 minutes to learn more

Date: December 12, 2025
The Solana market has been oscillating around just above the $135 price level. As such, the market appears to be lacking key catalysts to drive the market towards significant movement.
Long-Term Trend — Bullish (Daily Chart)
Key Price Levels:
Resistance: $140, $145, $150
Support: $135, $125, $120
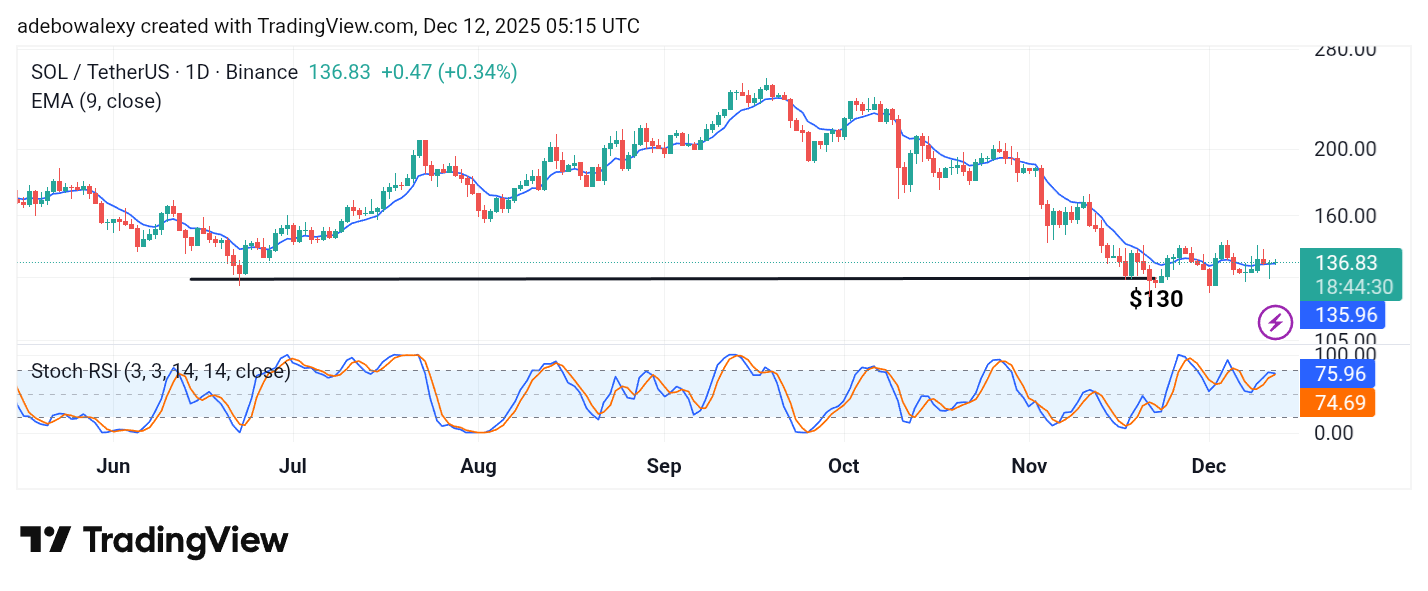
Trading in the Solana market is above the 9-day Exponential Moving Average (EMA) line. However, this is by a very tiny margin as presented by the corresponding price candle to the ongoing session. Meanwhile, the lines of the Stochastic Relative Strength Index (SRSI) indicator have risen past the 70 threshold and are now at the 75 level by the lead line. There seems to be a slight deflection towards a bearish crossover.
Solana (SOL) Price Prediction: SOL/USDT Keeps Struggling Below the $140 Threshold
Of late, the Solana market seems to be under strong headwinds. Price action has been oscillating below the $140 price level for a while now. However, the last two price candles can be seen hugging the 9-day EMA indicator line from above.
The trajectory of the SRSI indicator lines as well still aligns with the short-term path of the market as it stays above the 9-day EMA curve. Be that as it may, the mentioned price candles have only presented very little price movement.
Solana (SOL) Price Prediction: SOL/USDT Upside Momentum Thins Out (4-Hour Chart)
In the Solana 4-hour chart, price action seems to have a more progressive upside movement. Here, price action has risen clearly past the 9-day EMA curve. The last price candle here stands at a distance above the 9-day EMA curve.
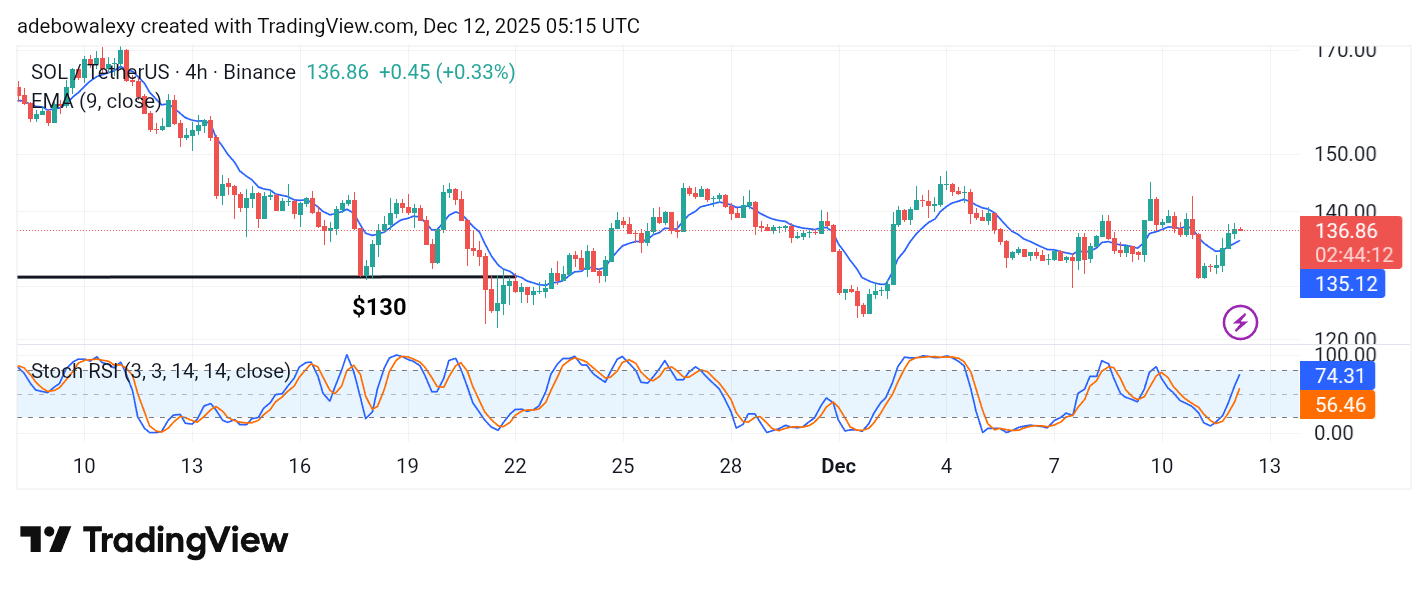
The last price candles appearing after price activity rose past the 9-day EMA curve are progressively smaller and present the impression that upside momentum wanes. Furthermore, the SRSI lines are still rising but seem a bit exaggerated considering that the market isn’t moving that much lately. Be that as it may, upside targets for short-term gains can still be placed at the $140 price level.