Solana (SOL) Price Prediction: SOL/USDT Steep Decline Faces Rejection
Estimated Reading Time: 2 minutes
Don’t invest unless you’re prepared to lose all the money you invest. This is a high-risk investment and you are unlikely to be protected if something goes wrong. Take 2 minutes to learn more

Date: February 7, 2026
The most recent price candle shows a notable rebound during the previous session. However, the market remains broadly influenced by bearish sentiment.
Long-Term Trend — Bearish (Daily Chart)
Key Price Levels
Resistance: $90, $95, $100
Support: $80, $75, $70
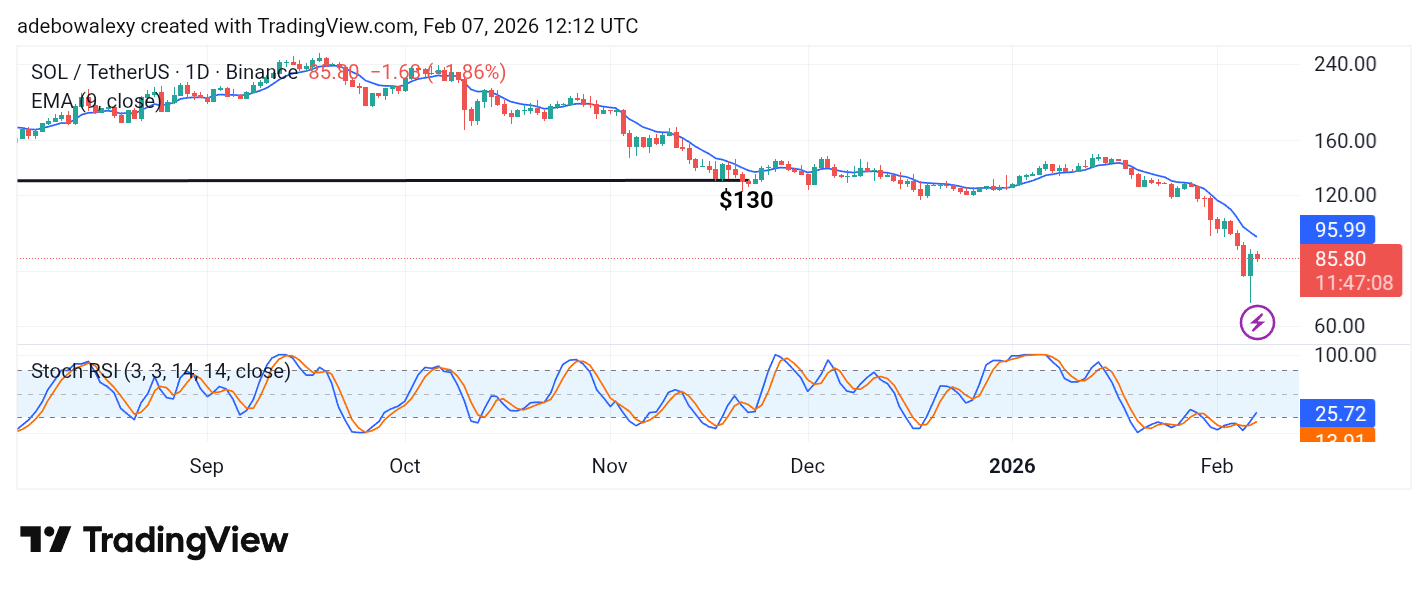
The Solana market recorded an upward rebound in the previous session. However, the ongoing session has shown a pullback below the prior session’s close, keeping price action below the 9-day Exponential Moving Average (EMA). Meanwhile, the Stochastic Relative Strength Index (SRSI) lines continue to trend upward.
Solana (SOL) Price Prediction: SOL May Lack Strong Upward Momentum
The Solana market experienced a notable pullback in the previous session, and the ongoing session has extended this downward movement. As a result, price action remains below the 9-day EMA curve.
At the same time, the SRSI lines continue to move upward from within the oversold region, creating a mixed market outlook. Nevertheless, price remains above the opening level of the previous session, suggesting some underlying support.
Solana (SOL) Price Prediction: SOL/USDT Consolidates Around the 9-Day EMA (4-Hour Chart)
On the 4-hour chart, the most recent candle suggests that bulls are attempting to defend current levels. Price action is trading just above the 9-day EMA curve.
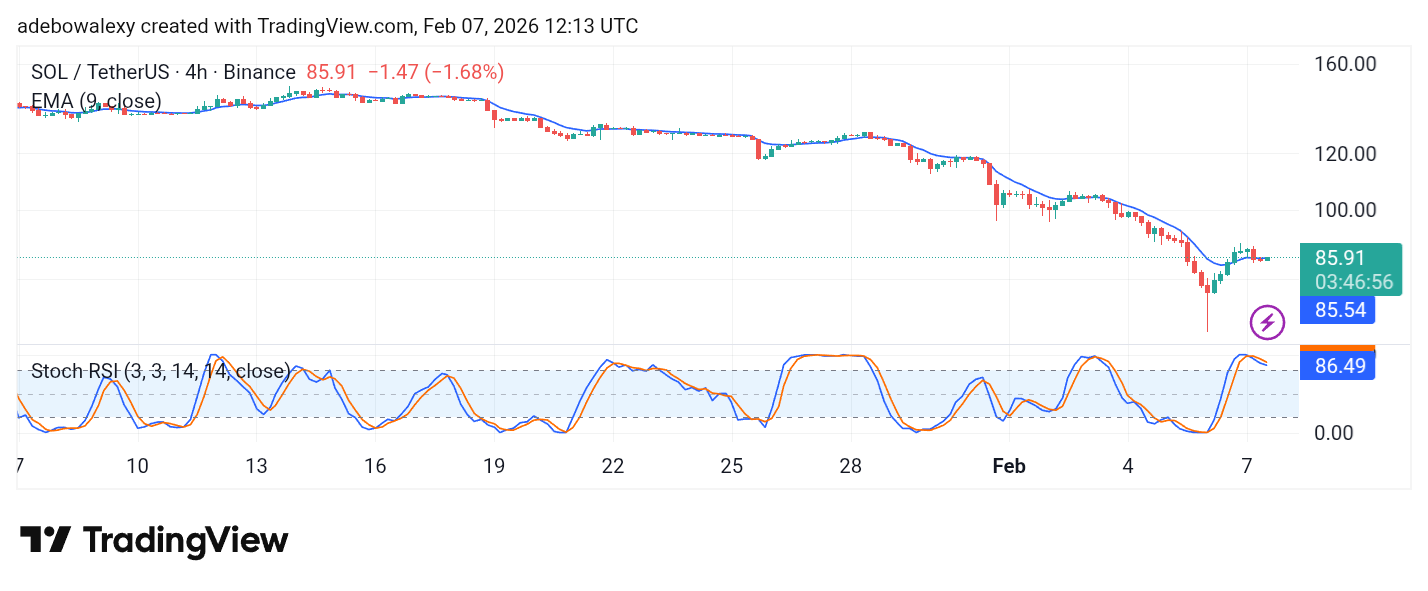
Meanwhile, the SRSI lines are in the overbought region but have begun to slope slightly downward, indicating a potential short-term pause. As a result, short-term trading opportunities may emerge toward the $90 resistance level.

