Solana’s Capital Flow Dynamics: Uncovering the Drivers of Growth
Estimated Reading Time: 6 minutes
Don’t invest unless you’re prepared to lose all the money you invest. This is a high-risk investment and you are unlikely to be protected if something goes wrong. Take 2 minutes to learn more

Since reaching its cycle low in November 2022, Solana has demonstrated remarkable strength, outperforming both Bitcoin and Ethereum in terms of price appreciation and relative capital inflows. A sustained influx of liquidity—totaling over $55 billion—has provided significant momentum, fueling its upward trajectory.
Despite periods of profit-taking and distribution, Solana investors have yet to reach levels of unrealized profitability that typically coincide with macro market tops. This suggests that the current cycle may still have room for further expansion, with the potential for continued growth ahead. In this analysis, we explore the underlying factors driving Solana’s capital movement and what they mean for the asset’s long-term outlook.
Solana vs. the Majors: A Surge in Capital and Market Dominance
Over the past four years, Solana has emerged as both a highly sought-after asset and a point of debate among investors and market analysts. While the 2021 bull run propelled it to impressive heights, the fallout from FTX’s collapse created a significant supply overhang that weighed on its price.
After hitting a low of $9.64, Solana staged a dramatic comeback, soaring by an incredible 2,143% over the past two years. This rally has allowed Solana to outpace both Bitcoin and Ethereum in performance on 344 out of 727 trading days since the FTX crisis, reflecting strong investor interest and market demand.
The influx of fresh capital has played a crucial role in this recovery. By analyzing the relative Realized Cap change among Solana, Bitcoin, and Ethereum, we can gauge the flow of capital into each network. Since the December 2022 low, Solana has experienced a significantly higher percentage increase in liquidity than its major counterparts, outperforming them in 389 out of 727 trading sessions.
To further evaluate demand momentum, we can examine the Hot Realized Cap—a metric that tracks capital held by wallets active within the last seven days. For the first time in its history, new capital inflows into Solana have surpassed those of Ethereum, underscoring its growing appeal among investors.
A key turning point occurred just before 2024, when Solana’s Hot Realized Cap saw a sharp increase. This marked a pivotal moment in the SOL/ETH ratio, as a surge in new capital propelled further price appreciation and strengthened Solana’s position in the market.
Examining Solana’s Capital Flow Dynamics
Having established Solana’s strong performance relative to major cryptocurrencies, we now turn to an in-depth analysis of its capital flows, assessing both liquidity inflows and sell-side pressures.
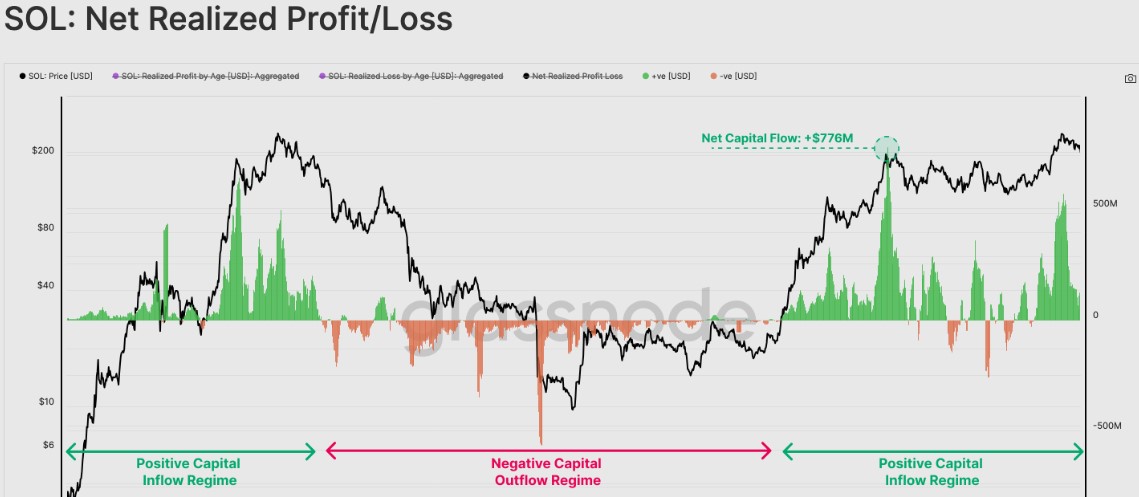
By examining the Net Realized Profit/Loss metric, which represents the first derivative of the Realized Cap, we can track the daily fluctuations in on-chain capital movements. Positive readings indicate net capital creation (coins transacting in profit), while negative values reflect capital destruction (coins moving at a loss).
Since early September 2023, Solana has maintained a consistent net capital inflow, with only brief periods of outflows. This steady stream of liquidity has fueled its price growth, peaking at an impressive $776 million in new capital inflows per day.
Understanding Sell-Side Pressure
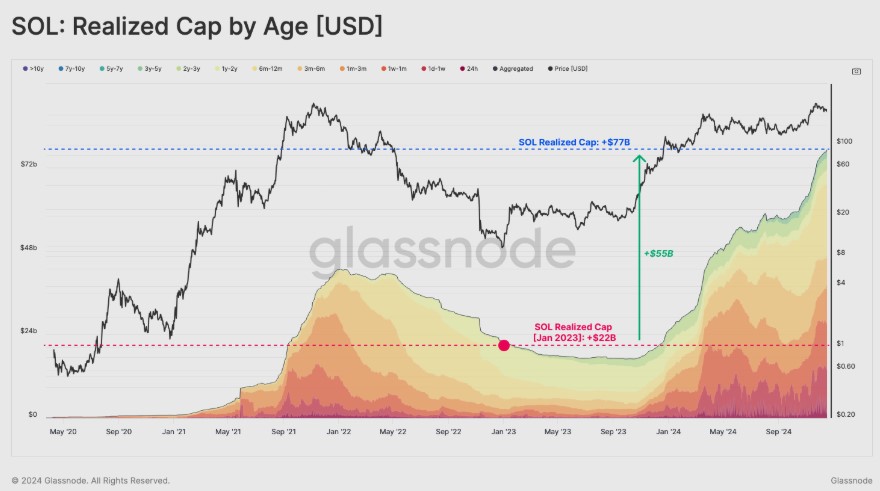
To gain deeper insight into market behavior, we can analyze the age distribution of realized profits to identify which investor groups are contributing most to sell-side pressure. The cumulative profit-taking volume by age cohort since January 2023 reveals the following:
- 24 hours: $3.1B
- 1 day – 1 week: $13.7B
- 1 week – 1 month: $14.0B
- 1 month – 3 months: $8.5B
- 6 months – 12 months: $15.7B
- 1 year – 2 years: $8.2B
- 2 years – 3 years: $8.2B
- 3 years – 5 years: $3.5B
Notably, the 1d-1w, 1w-1m, and 6m-12m cohorts have been the largest profit takers, collectively accounting for 51.6% of all realized profits. This suggests a well-balanced distribution of market influence across short- and mid-term holders, reinforcing Solana’s appeal across different investor profiles, from retail traders to institutional players.
Over this same period, Solana has witnessed a staggering +$55 billion in net liquidity inflows, pushing its Realized Cap from $22 billion to an all-time high of $77 billion.
Is the Market Overheated?
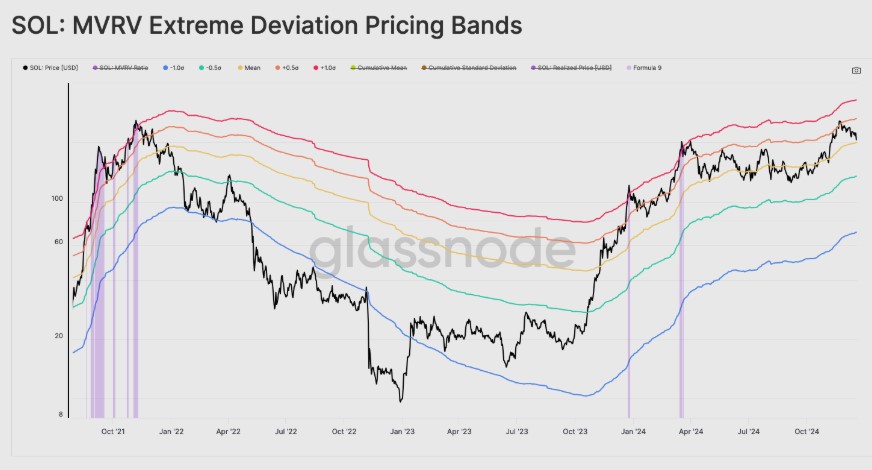
Given the significant capital inflows and profit-taking activity, it is crucial to assess whether Solana’s market has become overheated. The MVRV Ratio, a key metric for identifying price deviations relative to historical investor profitability, provides insight into potential market tops.
Historically, breakouts beyond one standard deviation (+1σ) have signaled macro topping formations. Currently, SOL is consolidating between the mean and +0.5σ range, indicating that while the market is heating up, it has yet to reach extreme profit-taking levels that typically precede major corrections. This suggests that there may still be room for further upside before reaching the threshold that triggers widespread distribution.
Final Thoughts
The introduction of new capital flow metrics has provided an unprecedented look into Solana’s investor behavior during dynamic market conditions. Solana’s extraordinary recovery and sustained price appreciation have been fueled by a broad distribution of investors, spanning both institutional and retail participants.
With significant capital inflows, strong liquidity growth, and a market that, while heating up, has yet to reach exhaustion levels, Solana continues to position itself as one of the most resilient and high-growth assets in the digital asset space.