$SPONGE (SPONGE/USD) Faces Crucial Test at $0.00004 Resistance
Estimated Reading Time: 2 minutes
Don’t invest unless you’re prepared to lose all the money you invest. This is a high-risk investment and you are unlikely to be protected if something goes wrong. Take 2 minutes to learn more

The subtle bearish trend in the $SPONGE market appears to be coming to an end as the price faces resistance at the $0.00004 level. A breakout above this level would likely shift the market back into an upward trajectory. Previously, bears had consistently exerted their influence, pushing resistance levels downward. However, the bulls have shown resilience, preventing a drastic decline. The market found pivotal support at $0.000026, which has initiated the recent upward movement.
Key Market Dynamics:
- Resistance Levels: $0.0010, $0.0011, and $0.0012
- Support Levels: $0.000026, $0.000025, and $0.000024
$SPONGE (SPONGE/USD) Technical Outlook
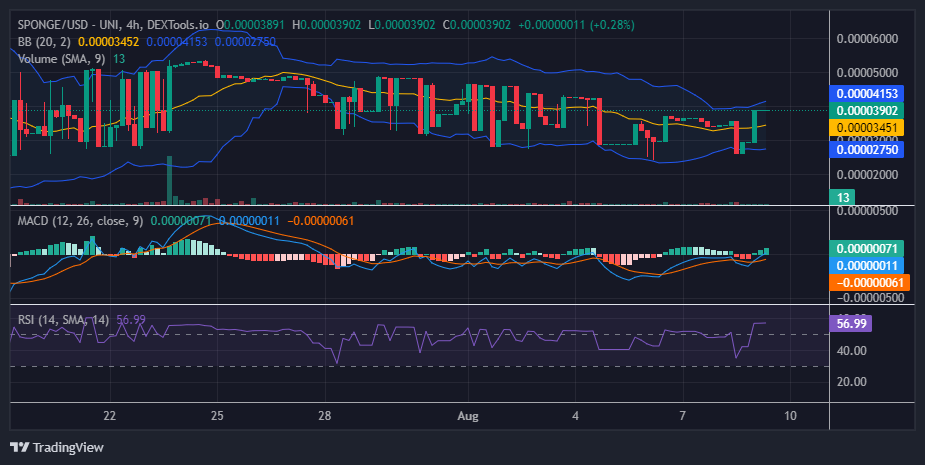
In the first 4-hour trading session, a Marubozu candlestick emerged, signaling strong bullish momentum that propelled the market from $0.00002925 to $0.000039. However, after reaching this threshold, price action has stagnated at $0.000039, with both demand and supply at a standstill. This market condition is clearly reflected in the chart. Although the Moving Average Convergence and Divergence (MACD) indicator shows progressively increasing histogram heights, the price remains flat at $0.000039. Similarly, the Relative Strength Index (RSI) reflects this lack of momentum, remaining steady at 56.99 for two consecutive 4-hour sessions.
$SPONGE (SPONGE/USD) 1-Hour Chart Insights
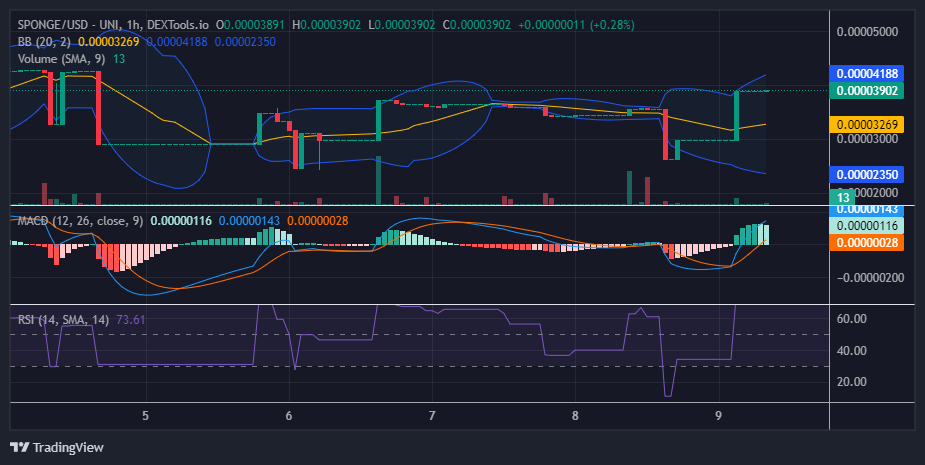
The Moving Average Convergence and Divergence (MACD) indicator is beginning to show signs of weakening bullish momentum. In addition to the crypto signal, 4-hour Doji candlestick pattern, which has consistently characterized the market during the last three hours of trading, the histograms in the last two 1-hour sessions are starting to fade to a lighter green. Although the price action appears to be encountering resistance, it has successfully broken through the most recent resistance level at $0.000036, marking a significant milestone in the ongoing bullish recovery trend.
Absorb the damp with SPONGE/USD!
Where the damp at? 💦 pic.twitter.com/KClTbufmqI
— $SPONGE (@spongeoneth) August 7, 2024
Join the SPONGE community and be part of the next big crypto sensation! Buy Sponge ($SPONGE) today!